 View the most recent version.
Information identified as archived is provided for reference, research or recordkeeping purposes. It is not subject to the Government of Canada Web Standards and has not been altered or updated since it was archived. Please "contact us" to request a format other than those available.

The Daily. Thursday, January 25, 2001
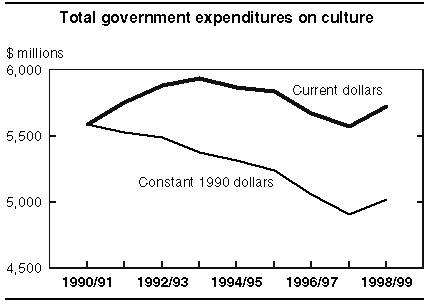
The estimated total government spending on culture increased in the fiscal year 1998/99, halting four consecutive years of decline.
The three levels of government spent an estimated total of $5.7 billion on everything from libraries and museums to nature parks and broadcasting. In constant dollars, spending was up 2.3% from 1997/98, the first real increase since 1990/91. In current dollars, spending was up 2.7%.
Remaining data in this release are in current dollars, with no adjustment for inflation.
Spending by the federal and provincial/territorial governments increased, while municipal spending fell. This reversed the trends during much of the 1990s, when municipalities increased their cultural spending while other levels were reporting declines.
Per-capita government expenditures on culture
1998/99
| Federal | Provincial/territorial | Municipal(1) | |
|---|---|---|---|
| $ | |||
| Canada | 93(2) | 62 | 45 |
| Newfoundland | 74 | 66 | 20 |
| Prince Edward Island | 123 | 74 | 11 |
| Nova Scotia | 99 | 72 | 34 |
| New Brunswick | 65 | 52 | 25 |
| Quebec | 126 | 89 | 30 |
| Ontario | 98 | 43 | 47 |
| Manitoba | 59 | 75 | 46 |
| Saskatchewan | 43 | 68 | 60 |
| Alberta | 45 | 45 | 52 |
| British Columbia | 38 | 71 | 69 |
| Yukon | 467 | 347 | 17 |
| Northwest Territories | 457 | 146 | 25 |
| 1 | Municipal spending is on a calendar-year basis. |
| 2 | Also includes unallocated expenditures. |
The federal government spent $2.8 billion on culture in 1998/99, up 5.9% in current dollars. The provinces and territories spent $1.9 billion, a 9.0% increase. Municipal spending fell 7.9% to $1.4 billion.
Municipalities spent $45 per capita in 1998, equal to the amount spent at the beginning of the decade. During this same period, however, federal outlays fell $11 to $93 per capita, and provincial/territorial spending declined $2 to $62.
|
The 5.9% increase in federal cultural outlays in 1998/99 halted declines that began in 1991/92. Although spending rose in 1994/95 and 1995/96, these increases resulted primarily from severance payments associated with the downsizing of federal cultural departments and agencies. All three categories of federal spending - operating expenditures, capital expenditures and grants - were up in 1998/99.
The $2.1 billion allocated to departmental and operational budgets in 1998/99 represented about 73% of the total federal cultural budget. After declining at an annual average rate of around 1.5% over the last seven years, operational budgets increased 2.2% in 1998/99, but were still 8.0% less than peak spending in 1990/91.
The largest percentage increases in federal operational budgets occurred in Prince Edward Island (+20.6%), New Brunswick (+11.9%) and Quebec (+11.4%), owing largely to increased spending on broadcasting. In six provinces and territories, federal operational budgets fell; the greatest declines were in Nova Scotia (-7.2%) and Newfoundland (-5.5%). This was mainly the result of decreased operational spending on heritage related activities.
In terms of departmental operational spending by cultural activity, broadcasting accounted for nearly two-thirds of the total federal operational budget. A 2.9% increase in this area was mainly because of spending growth in Quebec. Heritage activities, which consume about one-quarter of the total federal culture operational budget, also increased (+ 2.6%) in 1998/99. Spending in Quebec contributed significantly to the increase.
Federal grants, contributions and other transfers to artists and cultural organizations increased 15.3% to $513.2 million in 1998/99. This was the third consecutive year of growth following three straight annual declines. Grants and contributions accounted for nearly one-fifth of the total federal cultural budget in 1998/99. The sectors benefiting most from the increase were heritage activities, performing arts and broadcasting. Increases in grants and contributions occurred in all provinces and territories, except Prince Edward Island and the Northwest Territories.
Capital spending was $259.1 million, or 9%, of total federal cultural outlays. After declining in the previous three years, capital spending was up 20.8% in 1998/99. Capital expenditures by their nature tend to show wide variations owing to the size of individual projects. A significant portion of the increase in capital outlays came from spending on nature parks in British Columbia, and from spending in the broadcasting sector in Quebec and Ontario, where most of the federal broadcasting production facilities are located.
Total cultural spending by the provinces and territories increased in 1998/99, after five consecutive yearly declines during which spending fell at an estimated annual average rate of 2.6%. The $1.9 billion spent in 1998/99 was still 4.5% lower than the peak in 1992/93.
Most of the changes in provincial/territorial spending during the 1990s can be attributed to spending patterns in Ontario, Quebec and Alberta. Spending in all other provinces and territories has remained relatively stable or showed only minor fluctuations during this period.
The largest item in provincial/territorial cultural spending in 1998/99 was $673.0 million on department operating budgets, a 2.6% increase from 1997/98. The increase was owing mostly to higher spending in the heritage sector in Ontario, Alberta and New Brunswick.
The second largest item was $668.6 million spent on libraries through both operating and capital grants and transfers, up 4.2% after several years of declines. This increase recouped about one-third of losses since the peak of 1993/94. Quebec, Ontario, Alberta and British Columbia were largely responsible for the change. About one-quarter of provincial/territorial spending on libraries took the form of transfers to municipal governments.
The largest percentage change in provincial/territorial spending came in operating grants, contributions and transfers to artists and cultural organizations, excluding libraries. The total of $398.7 million was up 27.9% from 1997/98 and followed five years of decline. Ontario and Quebec were again the major contributors to the changes.
Capital grants and contributions for the construction and expansion of cultural facilities grew for the third consecutive year. The $89.7 million reported in 1998/99 was up 26.6% from the preceding year. Quebec's contributions to broadcasting facilities, performing arts organizations, and the film and video industry figured prominently in the increase. However, the expiration of a federal-provincial program for developing heritage resources in Newfoundland contributed to the 6.6% decline in capital grants to the heritage sector.
Provincial/territorial capital spending rose 13.5% to $55.5 million in 1998/99. However, this represented only 3% of their total cultural budgets.
The 7.9% drop to $1.4 billion in municipal cultural spending in 1998 was the first large decline in 14 years. Libraries dominate municipal cultural expenditures, representing about four-fifths of the total. In 1998, library operating budgets fell for the first time in 14 years, declining 4.3%. The reductions in library budgets contributed significantly to the 1998 reduction in overall cultural spending by municipalities in most of the provinces and territories.
Quebec municipalities reported the largest decline in cultural expenditures (-19.3%), followed by Ontario (-9.3%). Municipal spending increased in Alberta (+11.1%), Saskatchewan (+6.6%) and Nova Scotia (+4.9%). These increases were mainly the result of greater outlays on libraries and heritage activities.
In terms of capital spending, municipalities allocated $64.1 million to capital projects for libraries in 1998, about half the $122.6 million they spent the year before. This 1997 total was, in turn, almost twice the level in 1996, which was about $64.1 million.
Government expenditures on culture
| 1990/91 | 1993/94 | 1995/96 | 1997/98 | 1998/99 | 1997/98 to 1998/99 | |
|---|---|---|---|---|---|---|
| $ millions | % change | |||||
| Federal | 2,893 | 2,832 | 2,923 | 2,668 | 2,825 | 5.9 |
| Provincial/territorial | 1,778 | 1,939 | 1,801 | 1,730 | 1,886 | 9.0 |
| Municipal(1) | 1,237 | 1,413 | 1,420 | 1,479 | 1,362 | -7.9 |
| All levels(2) (current dollars) | 5,587 | 5,833 | 5,836 | 5,573 | 5,725 | 2.7 |
| All levels(2) (1990 constant dollars) | 5,587 | 5,373 | 5,241 | 4,910 | 5,021 | 2.3 |
| 1 | Municipal spending is on a calendar-year basis; for example, 1998/99 represents the period from January 1 to December 31, 1998. |
| 2 | These totals exclude inter-governmental transfers, therefore they cannot be derived by adding the three figures above. |
Selected data from the Government Expenditures on Culture Survey are now available in table format in Government expenditures on culture, 1998/99 (87F0001XPB, $50). Data from this survey are also available by province and territory. Special tabulations are available on a cost-recovery basis.
For more information, or to enquire about the concepts, methods or data quality of this release, or to order standard or special tabulations, contact Norman Verma (613-951-6863; fax: 613-951-9040; vermnor@statcan.gc.ca), Culture Statistics Program.