


|
|
| |
Information identified as archived is provided for reference, research or recordkeeping purposes. It is not subject to the Government of Canada Web Standards and has not been altered or updated since it was archived. Please "contact us" to request a format other than those available.

|

Thursday, February 19, 2004 Annual Review of the Consumer Price Index2003In 2003, consumers paid an average of 2.8% more for the goods and services in the Consumer Price Index (CPI) basket than they did in the previous year. This rise was slightly larger than the 2.2% annual average gain in 2002, and similar to the increase of 2.6% in 2001. 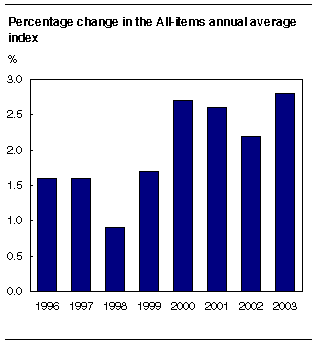
Most of the upward pull in 2003 occurred in the services sector, where prices rose 3.6% on average. In comparison, prices of goods, which are influenced much more by the impact of the stronger Canadian dollar, increased only 1.9%. Price increases in the services sector have been accelerating since 1999. Durable goods prices, however, have been trending down over the last four years, falling 0.8% in the last year. Semi-durable goods prices declined 1.5% on average, while prices of non-durable goods jumped 4.3%.
A large part of the jump in the non-durable goods index was the result of a 7.9% increase in energy prices. Excluding energy prices, the CPI rose 2.4% on average in 2003, after increasing 2.8% in 2002. Excluding the eight most volatile components, as defined by the Bank of Canada, the CPI rose 2.2% on average in 2003, following a 2.4% average increase in 2002. Transportation had strongest influence on average CPI increaseHigher automotive vehicle insurance premiums (+22.1%) and stronger gasoline prices (+6.4%) were the main factors behind a 5.2% average annual increase in the transportation component of the CPI in 2003. In fact, the transportation component had the strongest upward influence on the all-items index in 2003. (Influence is measured by taking into account both the magnitude of the price change and the proportion that the spending category represents of the total expenditure patterns of Canadians.) However, the automotive vehicle purchase index, which fell for a fourth consecutive year, exerted some downward pressure on the transportation component. The shelter index also exerted an important upward push on the CPI, rising 3.3% on average. The shelter index was pulled up mostly by higher natural gas prices, homeowners' replacement costs and homeowners' insurance premiums, while electricity prices exerted some downward pressure. Natural gas prices soared 30.1% on average in 2003. However, this substantial gain was largely the result of unusually low index levels between March and October 2002. This was the result of an Alberta gas company returning part of the receipts from the sale of a gas field to its Northern customers. Compared with 2001 levels, natural gas prices in 2003 were only 6.6% higher. Homeowners' replacement costs were up 6.4% on average, the strongest increase since 1989. The rate of increase in the index has been accelerating in the last four years, as the housing market in Canada has been heating up, helped by low interest rates. Homeowners' replacement costs, which represent the expenditures necessary to compensate for house depreciation, are estimated using new housing prices (excluding land). The electricity index fell on average 2.0% in 2003, almost entirely because of a 4.4% decline in the electricity index for Ontario. The Ontario government opened its electricity market to competition in May 2002, but subsequently instituted a fixed price in December 2002 retroactive to May 2002. The annual average index was affected both by this change and by refunds paid to consumers in 2003. Modest gain in food pricesFood prices advanced only 1.7% on average in 2003, less than the annual average for the all-items CPI. The index for food purchased from stores rose 1.5% on average, while that of food purchased from restaurants increased 2.5%. A case of bovine spongiform encephalopathy (BSE) discovered in May 2003 in Alberta drove beef prices down over the summer. As a result, the beef index rose only 0.8%, the smallest annual increase since 1997. At the provincial level, declines in beef prices were much stronger in the Prairie Provinces and in British Columbia. As a result, the annual average index for beef fell in 2003 in those provinces, while it increased in other provinces. 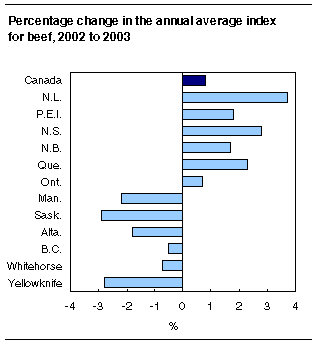
The alcoholic beverages and tobacco products component also exerted upward pressure on the all-items index, rising 10.0% on average. A large part of this increase stemmed from higher cigarette taxes, which contributed to pushing up cigarette prices by 16.2% on average in 2003. Alcoholic beverage prices were up 2.2% on average. Substantial drop in traveller accommodation pricesTraveller accommodation prices fell 10.1% on average in 2003, marking the third consecutive annual decline and the strongest to date. Over the past year, the tourism industry has been affected by a number of factors, including the economic slowdown in the United States, a higher Canadian dollar, global instability and the outbreak of severe acute respiratory syndrome (SARS). The price drops for traveller accommodation and for computer equipment and supplies helped slow down the increase in the index for the recreation, education and reading component. This index advanced only 0.8% in 2003, the smallest annual average increase since the series began in 1949. Higher tuition and cablevision fees exerted upward pressures. Health and personal care prices rose 1.3% on average. Most of this increase stemmed from higher prices for health care services, especially dental care. The clothing and footwear index was the only major component index to decrease in 2003. Prices fell 1.8% on average, declining for a second year in a row. All components of clothing fell in price, except for men's footwear (excluding athletic footwear), jewellery, and clothing material, notions and services. The steepest decline, 5.9%, was observed for children's clothing. Available on CANSIM: table 326-0002. Definitions, data sources and methods: survey number 2301. More information about the concepts and use of the CPI is available online in "Your guide to the consumer price index" (/pub/62-557-x/4060137-eng.htm). The January Consumer Price Index will be released on February 20. The full article on which this release is based will be available in the January 2004 issue of Consumer Price Index (62-001-XIB, $9/$83; 62-001-XPB, $12/$111), to be released on February 20, 2004. For more information, to enquire about the concepts, methods or data quality of this release, or to obtain the full article, call Rebecca McDougall (1-866-230-2248; 613-951-9606; infounit@statcan.gc.ca), Prices Division. |
|
|
|

