


|
|
| |
Information identified as archived is provided for reference, research or recordkeeping purposes. It is not subject to the Government of Canada Web Standards and has not been altered or updated since it was archived. Please "contact us" to request a format other than those available.

|

Friday, February 27, 2004 Canadian economic accounts2003 and fourth quarter 2003Real gross domestic product (GDP) advanced 1.7% in 2003, almost half the pace set in 2002, as exports fell for a third straight year. However, the economy ended the year with its best showing in six quarters, as exports rebounded and GDP advanced a solid 0.9%. Much of the strength came late in the quarter, as growth accelerated from 0.2% in October and November to 0.5% in December. 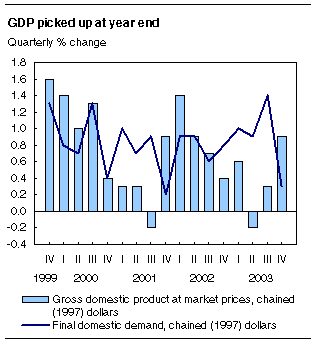
Exports were the main source of strength in the fourth quarter, bouncing back from a four-quarter slump and helping manufacturing to a strong year-end. Consumer spending was flat, as retail activity was driven down by sharply curtailed sales of motor vehicles. Additions to business inventories were more than three times those of the third quarter. Flat consumer and government spending in the fourth quarter coupled with a slowdown in business investment resulted in the weakest showing for final domestic demand (+0.3%) since the fourth quarter of 2001. As measured by the chain price index for GDP, economy-wide prices edged up 0.1% after gaining 0.9% in the third quarter. Industrial production (manufacturing, mining and utilities) surged 1.6% in the fourth quarter, after a depressed first half of the year. Higher manufacturing and mining production more than offset reduced output in the utilities sector, as electricity generation declined for the third consecutive quarter. Industrial production in the United States advanced 1.3%, with all major components registering gains. On an annualized basis, Canada's GDP growth for the fourth quarter was 3.8%. South of the border, the U.S. economy grew at an annualized rate of 4.1%, down from 8.2% in the third quarter.
Exports rebound after four-quarter slumpExports rebounded 3.2% in the fourth quarter after a four-quarter slump. Exports of industrial goods and materials surged 8.3%, while increased demand from south of the border spurred automotive product exports. Crude oil and natural gas exploration, extraction and distribution activity were all up and energy product exports jumped 4.2%. Imports were up 4.2%, driven by increased industrial activity. Automotive products imports rebounded 7.5%, while industrial goods and materials imports advanced 3.9% after four quarters of decline. 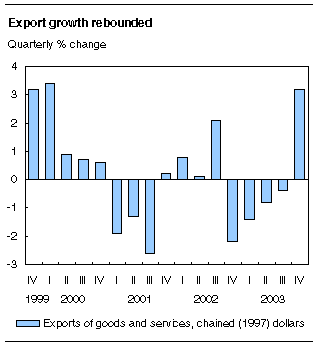
Manufacturing registers first gain in five quartersManufacturing output rose 2.0% in the fourth quarter, the first increase in five quarters. This reflected a number of factors, including a bounce-back from reduced output in the third quarter as a result of the electricity black-out in Ontario, the reopening of international borders to some Canadian beef products, robust housing construction in both Canada and the United States and higher demand for motor vehicles parts from American motor vehicle assembly plants. Information and communications technologies manufacturers registered a significant 4.4% increase in output, only the second gain in the last six quarters. Higher manufacturing production translated into increased activity for wholesalers, truck and rail transportation and warehousing industries. 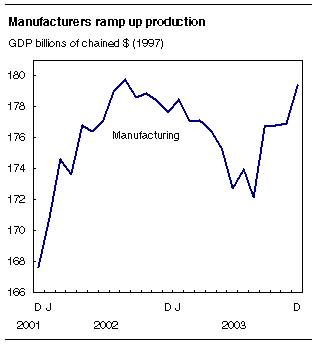
Weak car sales and good harvest boost inventoriesNon-farm inventories grew by $6.8 billion in the fourth quarter, after falling in the third. Wholesalers and retailers were largely responsible for the build-up. Retailers accumulated $3.7 billion of motor vehicle inventories, as sales dropped off. Manufacturing inventories were unchanged. Farm inventories were up $4.0 billion, as farmers added to their grain stockpiles and livestock holdings. Business plant and equipment spending easesBusiness spending on plant and equipment slowed to 0.6% in the fourth quarter after strong growth in the third. Outlays on engineering construction advanced 2.0%, a second straight quarter of growth, while outlays on building construction fell 1.7%. Investment in machinery and equipment edged up 0.3%, following a 4.5% gain in the third quarter. Outlays on telecommunications equipment were up 10%, the second consecutive strong quarter of growth. Investment in industrial machinery increased 2.4%, the fifth consecutive increase. Spending on trucks and transportation equipment other than automobiles was sharply curtailed. Corporate profits and labour income make moderate gainsCorporate profits rose 3.5% in the fourth quarter, closing in on the record level set in the first quarter of 2003. The transportation and mining industries led, while oil and gas producers lost ground. Labour income recorded a solid 0.9% gain, as employment picked up after a lacklustre first three quarters of 2003. Much of the gain in labour income was offset by higher income taxes and personal disposable income advanced only 0.3%. Housing boom continues as interest rates fall even lowerHistorically low interest rates continued to fuel demand for new housing, as investment in new housing construction gained 4.7%. Transfer costs, which include real estate commissions, were down 4.7%, as the resale housing market cooled somewhat from a busy third quarter. The real estate agent and brokerage industry registered its first downturn since the third quarter of 2002. Manufacturers, wholesalers and retailers of furniture and appliances benefited from the continued housing boom. Consumer spending flatConsumer spending was flat after eight straight years of advances, averaging 0.8% per quarter. Despite generous incentives, spending on new cars fell 8.2% while purchases of new trucks plummeted almost twice as much. As a result, retailers recorded their first drop in activity in two years. Excluding motor vehicle dealers, however, retail activity advanced 1.0%. Purchases of semi-durable goods edged down, as spending on clothing and footwear fell 1.1%. Consumer outlays on services increased 1.0%, with tourism-related spending on restaurant meals, accommodation and transportation all recording advances. 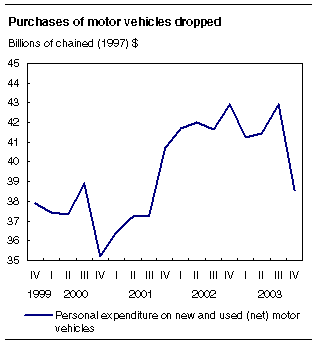
Travel and tourism regain groundIndustries in the travel-related sector enjoyed a brisk quarter as gains were reported for air travel, gambling, hotels and restaurants. Exports (+4.8%) and imports (+11%) of travel services both made solid gains. The number of travellers to Canada surged 9.0%, the largest increase since the first quarter of 1981.
2003 year-end reviewGDP advanced 1.7% in 2003, half its 3.3% pace in 2002. Consumers continued to shore up the economy for the third year in a row. Exports were a major source of weakness, while imports were up 4.0%. Business investment turned around, advancing 4.8% after edging down in 2002. 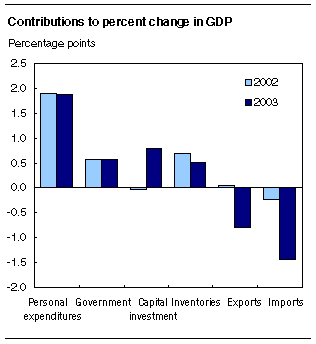
Final domestic demand picked up steam in 2003, advancing 3.6%, the strongest gain in three years. As measured by the chain price index for GDP, economy-wide prices advanced 3.4% driven in part by higher energy prices early in the year. Industrial production edged up 0.3% in 2003 after a 2.4% gain in 2002. Higher prices spurred oil exploration and extraction activity. Canada's diamond mining industry more than doubled its output, making Canada one of the world's leading producers. Output in utilities and manufacturing were both lower. Consumers shore up economy for third straight yearConsumer spending rose 3.3%, the third straight year in which consumers were a driving force behind economic growth. The housing boom continued to support robust gains in spending on furniture and appliances. Imports of other consumer goods were up 8.7%, the strongest gain in five years. Outlays for durable goods were up 2.3%, the weakest increase since 1995, as purchases of motor vehicles slipped from the record levels registered in 2002. Consumer spending on services advanced 4.1%, up from 2.6% in 2002. Personal saving down sharplyAfter averaging 5.0% growth in the previous five years, personal disposable income slowed to 2.8% in 2003, almost half the pace of consumer spending (in nominal terms). As a result, saving by the personal sector plummeted and the saving rate fell to a low of 2.0%. With the sharp drop in saving, personal sector net borrowing jumped $43 billion in 2003, following a $16 billion increase in 2002. 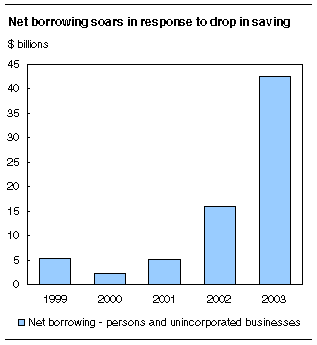
Low interest rates sustain housing boomInvestment in residential structures advanced a robust 7.4%, after a stellar 14% gain in 2002. Low mortgage rates continued to sustain the housing boom, albeit at a reduced pace. Housing starts approached near-record levels, renovation spending accelerated and the resale housing market registered another good year. Robust corporate profits spur investmentCorporate profits were up 10%, on solid earnings of oil and gas, wholesale and retail companies, as the corporate surplus hit a record level in 2003. Business investment in plant and equipment rebounded 3.4% after falling 6.0% in 2002. Investment in industrial machinery (+11%) and computers and other office equipment (+11%) were up sharply. Renewed strength in business investment boosted imports of machinery and equipment, up 3.9%, after two years of decline. Widespread build up of inventoriesBusinesses built up inventories for the second year in a row. Non-farm inventories were boosted as manufacturers, wholesalers and retailers all added to their stocks. Farmers stockpiled grain after a good harvest, following two years of drought. Restrictions on Canadian beef exports as a result of the mad cow scare led to higher inventories of farm livestock. The meat slaughtering and processing industry was also adversely affected, as output levels fell 5.3%. Exports down for third straight yearExports slumped 2.1% (in volume terms) in 2003, the third straight year of contraction. Almost all major categories of exports recorded declines, with industrial goods and materials and machinery and equipment hardest hit. Forestry product exports were one exception, advancing 0.5% after two years of decline. These gains came despite the forest fires in British Columbia and the continued Canada-US softwood lumber dispute. Output of the forestry industry was up 3.9%, while the sawmill industry increased its output by almost as much. Manufacturing edges downManufacturing edged down 0.4% in 2003, as the aerospace, machinery and clothing and textiles industries all recorded lower output. Production of motor vehicles was also lower. Manufacturing of telecommunications equipment fell sharply for a third straight year leaving output at pre-1997 levels. Industries feeding residential construction (wood products and non-metallic mineral products) fared well, while production of pharmaceutical products increased 8.9% after three years of stellar growth. Stronger dollar helps terms of tradeThe Canadian dollar appreciated 12% (based on annual average noon spot rates) against the US dollar in 2003. The chain price index for exports fell 1.0%, while that for imports fell 7.0%, resulting in an improvement in Canada's terms of trade. Another rough year for travel and tourismDespite picking-up in the second half of 2003, after fears related to SARS dissipated, consumer spending on transportation and restaurants and accommodation services were all down for the year. Exports of travel services were down sharply, along with the number of travellers to Canada. Imports of travel services rebounded 8.7%, as Canadians increased their travel spending abroad. Detailed analysis and tablesMore detailed analysis on today's releases from the national accounts, including additional charts and tables, can be found in the fourth quarter 2003 issue of Canadian Economic Accounts Quarterly Review, Vol. 2, no. 4 (13-010-XIE, free), available online. From the Our products and services page, under Browse our Internet publications, choose Free, then National accounts. Products, services and contact informationPreliminary provincial estimates for 2003 will be available on April 28. National economic and financial accountsAvailable on CANSIM: tables 378-0001, 378-0002, 380-0001 to 380-0017, 380-0019 to 380-0035, 380-0056, 380-0059 and 382-0006. Definitions, data sources and methods: survey numbers, including related surveys, 1804, 1901 and 2602. The fourth quarter 2003 issue of National Income and Expenditure Accounts, Quarterly Estimates (13-001-XIB, $36/$117; 13-001-XPB, $48/$156) will be available soon. Detailed printed tables of unadjusted and seasonally adjusted quarterly Income and Expenditure Accounts (13-001-PPB, $54/$193), Financial Flow Accounts (13-014-PPB, $54/$193) and Estimates of Labour Income (13F0016XPB, $22/$70), including supplementary analytical tables and charts are now available. At 8:30 am on release day, the complete quarterly income and expenditure accounts, financial flow accounts, and monthly estimates of labour income data sets can be obtained on computer diskette. The diskettes (13-001-DDB, $134/$535; 13-014-DDB, $321/$1284; and 13F0016DDB, $134/$535) can also be purchased at a lower cost seven business days after the official release date (13-001-XDB, $27/$107; 13-014-XDB, $65/$257; and 13F0016XDB, $27/$107). To purchase any of these products, contact Client Services (613-951-3810; iead-info-dcrd@statcan.gc.ca), Income and Expenditure Accounts Division. For more information, or to enquire about the concepts, methods or data quality of this release, contact the information officer (613-951-3640), Income and Expenditure Accounts Division. Gross domestic product by industryAvailable on CANSIM: tables 379-0017 to 379-0022. Definitions, data sources and methods: survey numbers, including related surveys, 1301 and 1302. The December 2003 issue of Gross Domestic Product by Industry, Vol. 17, no. 12 (15-001-XIE, $12/$118) is now available. A print-on-demand version is available at a different price. For general information or to order data, contact Yolande Chantigny (1-800-887-IMAD; imad@statcan.gc.ca). To enquire about the concepts, methods or data quality of this release, contact Jo Ann MacMillan (613-951-7248), Industry Measures and Analysis Division.
| |||||||||||||||||||||||||||||||||||||||||||||||||||||||||||||||||||||||||||||||||||||||||||||||||||||||||||||||||||||||||||||||||||||||||||||||||||||||||||||||||||||||||||||||||||||||||||||||||||||||||||||||||||||||||||||||||||||||||||||||||||||||||||||||||||||||||||||||||||||||||||||||||||||||||||||||||||||||||||||||||||||||||||||||||||||||||||||||||||||||||||||||||||||||||||||||||||||||||||||||||||||||||||||||||||||||||||||||||||||||||||||||||||||||||||||||||||||||||||||||||||||||||||||||||||||||||||||||||||||||||||||||||||||||||||||||||||||||||||||||||||||||||||||||||||||||||||||||||||||||||||||||||||||||||||||||||||||||||||||||||||||||||
|
|
|

