


|
|
| |
Information identified as archived is provided for reference, research or recordkeeping purposes. It is not subject to the Government of Canada Web Standards and has not been altered or updated since it was archived. Please "contact us" to request a format other than those available.

|

Wednesday, November 30, 2005 International Adult Literacy and Skills Survey: Building on our competencies2003Canadians with lower levels of literacy have lower rates of employment, and lower earnings, according to a new survey of literacy and numeracy among adults aged 16 and over. The 2003 International Adult Literacy and Skills Survey found a clear link between proficiency in literacy and an individual's employability. People with low proficiency in literacy tend to have lower rates of employment, and they tend to work in occupations with lower skill requirements. The survey tested more than 23,000 Canadians aged 16 and over on their proficiency in four domains: prose literacy, document literacy, numeracy and problem-solving. Proficiency was rated on the basis of levels one to five, that is, lowest to highest. In 2003, about 62% of employed Canadians between the ages of 16 and 65 had average scores in the document domain at Level 3 or above. Level 3 is the desired threshold for coping with the rapidly changing skill demands of a knowledge-based economy and society. In contrast, over one-half of unemployed Canadians of these ages had document literacy scores below Level 3. The survey also showed that people who work in more knowledge-intensive jobs (including such occupations as accountants, lawyers, economists, medical doctors, mathematicians, architects, college and university educators) tend to have higher proficiency in literacy and numeracy. In addition, the higher the proficiency in literacy, the more workers tend to earn, particularly women. The IALSS also collected data on participation in various forms of adult education and learning such as taking courses, participating in programs of study and attending workshops during the 12 months prior to the survey. It found that in all provinces and territories, there was a substantial difference between the participation rates of those with the lowest and highest levels of literacy. Overall, about half of Canadians aged 16 to 65 participated in adult education or learning activities in 2003. In all regions, around 70% of adults with the literacy scores at the highest level (Level 4/5), participated in adult education and learning. However, at 20%, this proportion was much lower for those at the lowest level of literacy (Level 1).
Strong link between literacy and employmentThe survey found that people who had scores in the document literacy domain at Level 1 (the lowest level of proficiency) had a much lower employment rate than those at higher levels of proficiency. About 57% of adults aged 16 to 65 at Level 1 were employed compared to more than 80% of those who scored at Level 4/5, the highest. The survey found a noticeable increase in the employment rate even between individuals in Levels 1 and 2, the two lowest proficiency levels. About 70% of individuals at Level 2 were employed. This relationship held throughout most regions in Canada, although it was stronger in some than in others. For example, in the territories and British Columbia, there was a large difference in employment rates by literacy level. Over 90% of those at Level 4/5 were employed in the territories compared to 50% of those at Level 1. In British Columbia the rates were 81% and 47% respectively. 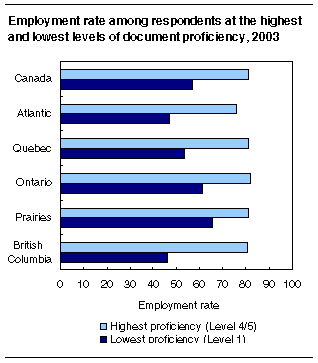
The difference in employment rates between people at Level 1 and people at Level 4/5 is smallest in Ontario and the Prairies. Occupations linked to literacy and numeracy proficienciesThe survey found that people who work in more knowledge intensive jobs tend to have higher literacy and numeracy proficiencies. The IALSS grouped occupations based on knowledge content and common skills, including cognitive, communication, management and motor skills. Knowledge expert occupations include such jobs as accountants, lawyers, economists, medical doctors, architects, college and university educators. Manager occupations include jobs such as corporate management, department managers, and senior government officials. Service occupations cover a range of occupations including travel attendants, housekeeping and restaurant workers, home care workers and hairdressers. Examples of goods-related occupations include fishery workers, miners, roofers, dairy and livestock producers, bricklayers and bakers. In most regions, the average scores of knowledge experts, managers and information skills professionals corresponded to Level 3 proficiency in prose literacy, document literacy and in numeracy. On the other hand, the average scores of workers in services and goods-related occupations across these three domains were generally at Level 2 proficiency. At the national level, workers in two industries stood out as having relatively high average proficiency scores in prose and document literacy, and in numeracy. These were knowledge-intensive market services industries; and public administration, defense, education and health. Some industries are more dependent on technology and knowledge inputs than others and the IALSS grouped manufacturing industries according to their relative intensity of technology use (high, medium-high, medium-low and low). Market service industries were grouped according to their use of knowledge inputs. The knowledge-intensive market service activities category includes post and telecommunications, finance and insurance, and business activities. Examples of primary industries include agriculture, hunting and forestry; fishing; mining and quarrying. Two industries, low- and medium-low technology manufacturing, and primary industries, had workers with average scores at Level 2 in prose, document and numeracy domains. There were some notable regional differences in the proficiencies of workers by industry — most likely a reflection of the nature of industries in these regions. For example, in the Prairies, British Columbia and the territories, about one in five workers in the primary industries were at the highest level of proficiency (Level 4/5). This was about twice the proportion that was found in the Atlantic region, Quebec and Ontario. Clear association between literacy and earningsThe survey showed a clear link between high proficiency in prose literacy and earnings, reinforcing findings of previous studies. However, the link was generally stronger for women than for men at both the national and regional levels. Just under a third of men who were earning at least $60,000 a year were at the highest level of prose proficiency, compared to 15% among those earning less than $20,000. The difference was even greater for women. About one-half of women with annual earnings of $60,000 or more were at the highest level of prose literacy, compared with 19% who earned less than $20,000. The situation was somewhat different at the lowest end of the literacy scale. A much higher proportion of men than women who were earning at least $60,000 a year were at the lowest levels of literacy. One in four men were at this level, but fewer than one in ten women. Literacy associated with health and community participationAlthough the nature of the relationship between health and literacy needs to be explored further, the survey evidence suggests that health issues and literacy issues intersect. The IALSS measured health using a widely recognized and validated set of questions on self-reported physical and mental health. Responses to the questions on physical health were used to establish four groups: poor, fair, good and excellent. Those aged 16 to 65 who reported being in poor physical health scored lower in document literacy than did those reporting better health. In each of the provinces and territories, with the exception of the Yukon, about half of all seniors (older than 65) reported being in poor physical health. In each jurisdiction, the average document literacy score of seniors reporting poor health was at Level 1. Given that about half of all seniors reported being in poor physical health and that they scored at the lowest level of proficiency there may be serious implications for their overall quality of life. Higher levels of prose literacy are associated with higher levels of involvement in various community groups and organizations and in volunteer activities. Half of all respondents at the lowest level of prose literacy proficiency, compared with one in five at the highest, reported that they were not involved in any of the community activities measured by the IALSS. In a society ever more dependent on obtaining its information through electronic means, familiarity with, and use of, information and communications technologies is almost a necessity. The survey results showed that use of computers was lowest among those with low prose literacy — meaning that in addition to a digital divide, non-users may also face a literacy challenge.
Definitions, data sources and methods: survey number 4406. The publication Building on our Competencies: Canadian Results of the International Adult Literacy and Skills Survey, 2003 (89-617-XIE, free) is now available online. From the Our products and services page, under Browse our Internet publications, choose Free, then Education. For more information, or to enquire about the concepts, methods or data quality of this release, contact Client Services (1-800-307-3382; 613-951-7608; fax: 613-951-9040; educationstats@statcan.gc.ca), Culture, Tourism and the Centre for Education Statistics. | ||||||||||||||||||||||||||||||||||||||||||||||||||||||||||
|
|
|

