
Statistics Canada
www.statcan.gc.ca
Common menu bar links
Wholesale trade

Archived Content
Information identified as archived is provided for reference, research or recordkeeping purposes. It is not subject to the Government of Canada Web Standards and has not been altered or updated since it was archived. Please "contact us" to request a format other than those available.
Wholesale sales fell 1.6% from October to $44.4 billion in current dollars in November, as decreases in four out of seven sectors contributed to the third decline in four months. In terms of the volume of sales, wholesale sales were down 3.0%.
Chart 1
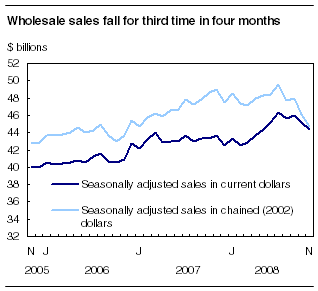
Canadian wholesalers sell to both the domestic and international markets, and are active importers and exporters. The decline in sales reflected both lower export demand for Canadian goods, a significant part of which flows through wholesale markets, and weaker sales in Canada.
At current prices, the machinery and electronic equipment sector declined 1.6% in November, reflecting a 1.9% sales drop in the machinery and equipment trade group, which accounts for half the sector.
Sales in the automotive products sector declined 2.2% in November, its second consecutive monthly decrease. Sales of motor vehicles fell 2.3% from October to $5.1 billion, and have fallen by just over one billion dollars since July 2008. Motor vehicle sales in November were at their lowest level since August 2003.
The largest decline (-6.0%) came in the "other products" sector, which fell to its lowest level since March 2008. A significant decrease in both agricultural chemical and other farm supplies, as well as lower demand and prices for recyclable metals, were the main contributors to the decline in this sector.
Sales in the building materials sector decreased 1.3%, as a result of declines in the metal products (-4.3%) and lumber and millwork (-3.5%) trade groups. This was the third time since January 2008 that this sector posted lower sales.
Note to readers
Wholesale sales in volume terms are calculated by deflating current dollar values using import and industry product price indexes. Since many of the goods sold by wholesalers are imported, fluctuations in the value of the Canadian dollar can have an important influence on the prices of goods bought and sold by wholesalers. The wholesale sales series in chained (2002) dollars is a chained Fisher volume index with 2002 as the reference year.
Definition
The "other products" sector is comprised of recycled metal, recycled paper and paperboard, stationery and office supplies, other paper and disposable plastic products wholesalers, agricultural feed and seed wholesalers, agricultural chemical and other farm suppliers, chemical, log and wood chip wholesalers, mineral, ore and precious metal wholesalers, second-hand goods wholesalers (except machinery and automotive), and all other wholesalers.
The farm products sector advanced 3.5% while sales rose 0.2% in both the food, beverages and tobacco sector and the personal and household goods sector.
Sales down in nine provinces
Overall, sales were down in nine provinces in November.
Wholesalers reported lower sales in both Ontario (-1.2%) and Quebec (-2.3%) during the month. Lower sales in the "other products" and the automotive sectors were the major contributors to the decreases in Ontario in November. In Quebec, the decline reflected weakness in a number of sectors including the "other products" sector and the building materials sector.
All of the western provinces reported lower sales in November, ranging from a 1.3% decline in British Columbia to a 2.1% drop in Saskatchewan (the third consecutive monthly decrease in this province).
Among the Atlantic provinces, only Prince Edward Island (+5.1%) posted higher sales in November.
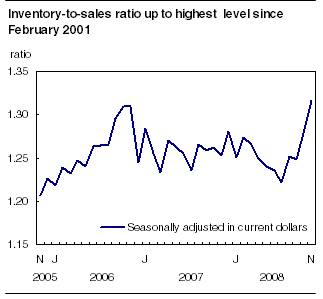
Inventories continue to climb
Wholesale inventories rose for a ninth consecutive month, increasing 1.0% in November.
Overall, 10 of the 15 wholesale trade groups reported higher inventory levels, including the pharmaceuticals (+4.2%), motor vehicle parts and accessories (+2.4%) and building supplies (+1.6%) trade groups.
The slowdown in sales and rise in inventories led to an increase in the inventory-to-sales ratio from 1.28 in October to 1.32 in November. This was the highest level since February 2001. The inventory-to-sales ratio is a measure of the time, in months, that would be required to exhaust inventories if sales were to remain at their current level.
Chart 2
Available on CANSIM: tables 081-0007 to 081-0010.
Definitions, data sources and methods: survey number 2401.
The November 2008 issue of Wholesale Trade (63-008-XWE, free) will soon be available.
Wholesale trade estimates for December will be released on February 19.
To obtain data or for general information, contact Client Services (toll-free 1-877-421-3067; 613-951-3549; wholesaleinfo@statcan.gc.ca). To enquire about the concepts, methods or data quality of this release, contact Steve Chadder (613-951-0303; steve.chadder@statcan.gc.ca), Distributive Trades Division
Table 1
| November 2007 | August 2008r | September 2008r | October 2008r | November 2008p | October to November 2008 | November 2007 to November 2008 | October 2008r | November 2008p | |
|---|---|---|---|---|---|---|---|---|---|
| Wholesale inventories | Inventory-to-sales ratio | ||||||||
| Seasonally adjusted | |||||||||
| $ millions | % change | ||||||||
| Inventories | 54,718 | 57,036 | 57,380 | 57,890 | 58,481 | 1.0 | 6.9 | 1.28 | 1.32 |
| Farm products | 172 | 191 | 182 | 182 | 178 | -2.2 | 3.8 | 0.39 | 0.37 |
| Food products | 4,196 | 4,510 | 4,542 | 4,604 | 4,670 | 1.4 | 11.3 | 0.63 | 0.64 |
| Alcohol and tobacco | 323 | 371 | 367 | 377 | 388 | 2.9 | 20.0 | 0.55 | 0.60 |
| Apparel | 1,814 | 1,897 | 1,910 | 1,934 | 1,935 | 0.1 | 6.7 | 2.31 | 2.26 |
| Household and personal products | 4,178 | 4,138 | 4,036 | 4,213 | 4,260 | 1.1 | 2.0 | 1.57 | 1.61 |
| Pharmaceuticals | 3,537 | 3,887 | 3,900 | 3,845 | 4,006 | 4.2 | 13.3 | 1.20 | 1.24 |
| Motor vehicles | 4,633 | 4,536 | 4,552 | 4,557 | 4,456 | -2.2 | -3.8 | 0.87 | 0.87 |
| Motor vehicle parts and accessories | 3,251 | 3,276 | 3,293 | 3,288 | 3,367 | 2.4 | 3.6 | 1.98 | 2.07 |
| Building supplies | 5,982 | 6,028 | 6,112 | 6,126 | 6,222 | 1.6 | 4.0 | 1.54 | 1.56 |
| Metal products | 2,771 | 3,074 | 3,136 | 3,197 | 3,192 | -0.2 | 15.2 | 1.86 | 1.94 |
| Lumber and millwork | 1,164 | 1,214 | 1,219 | 1,207 | 1,194 | -1.1 | 2.5 | 1.26 | 1.29 |
| Machinery and equipment | 11,739 | 11,699 | 11,890 | 11,955 | 12,085 | 1.1 | 2.9 | 2.25 | 2.32 |
| Computer and other electronic equipment | 1,725 | 1,904 | 1,823 | 1,854 | 1,882 | 1.5 | 9.1 | 0.65 | 0.67 |
| Office and professional equipment | 2,663 | 2,819 | 2,839 | 2,867 | 2,862 | -0.2 | 7.5 | 1.35 | 1.37 |
| Other products | 6,571 | 7,492 | 7,578 | 7,682 | 7,782 | 1.3 | 18.4 | 1.26 | 1.35 |
Table 2
| November 2007 | August 2008r | September 2008r | October 2008r | November 2008p | October to November 2008 | November 2007 to November 2008 | |
|---|---|---|---|---|---|---|---|
| Seasonally adjusted | |||||||
| $ millions | % change | ||||||
| Total, wholesale sales | 43,687 | 45,584 | 45,964 | 45,138 | 44,416 | -1.6 | 1.7 |
| Farm products | 443 | 477 | 475 | 465 | 482 | 3.5 | 8.7 |
| Food, beverages and tobacco products | 7,525 | 7,779 | 7,865 | 7,976 | 7,992 | 0.2 | 6.2 |
| Food products | 6,873 | 7,093 | 7,167 | 7,286 | 7,342 | 0.8 | 6.8 |
| Alcohol and tobacco | 653 | 686 | 699 | 690 | 650 | -5.8 | -0.4 |
| Personal and household goods | 6,591 | 6,819 | 6,826 | 6,726 | 6,739 | 0.2 | 2.2 |
| Apparel | 798 | 825 | 828 | 838 | 857 | 2.3 | 7.5 |
| Household and personal products | 2,795 | 2,735 | 2,751 | 2,678 | 2,647 | -1.2 | -5.3 |
| Pharmaceuticals | 2,999 | 3,259 | 3,248 | 3,210 | 3,235 | 0.8 | 7.9 |
| Automotive products | 8,044 | 6,957 | 7,305 | 6,896 | 6,745 | -2.2 | -16.2 |
| Motor vehicles | 6,501 | 5,412 | 5,614 | 5,235 | 5,115 | -2.3 | -21.3 |
| Motor vehicle parts and accessories | 1,543 | 1,546 | 1,691 | 1,662 | 1,629 | -2.0 | 5.6 |
| Building materials | 6,229 | 6,614 | 6,635 | 6,657 | 6,570 | -1.3 | 5.5 |
| Building supplies | 3,772 | 3,890 | 3,966 | 3,977 | 3,998 | 0.5 | 6.0 |
| Metal products | 1,408 | 1,749 | 1,713 | 1,719 | 1,645 | -4.3 | 16.8 |
| Lumber and millwork | 1,050 | 976 | 956 | 961 | 927 | -3.5 | -11.7 |
| Machinery and electronic equipment | 9,405 | 10,211 | 10,338 | 10,301 | 10,141 | -1.6 | 7.8 |
| Machinery and equipment | 4,593 | 5,271 | 5,329 | 5,322 | 5,218 | -1.9 | 13.6 |
| Computer and other electronic equipment | 2,745 | 2,846 | 2,890 | 2,855 | 2,826 | -1.0 | 3.0 |
| Office and professional equipment | 2,067 | 2,094 | 2,119 | 2,125 | 2,096 | -1.3 | 1.4 |
| Other products | 5,449 | 6,726 | 6,519 | 6,116 | 5,747 | -6.0 | 5.5 |
| Total, excluding automobiles | 35,643 | 38,627 | 38,659 | 38,242 | 37,671 | -1.5 | 5.7 |
| Sales, province and territory | |||||||
| Newfoundland and Labrador | 247 | 282 | 283 | 294 | 289 | -1.5 | 16.9 |
| Prince Edward Island | 40 | 40 | 42 | 43 | 46 | 5.1 | 14.3 |
| Nova Scotia | 580 | 605 | 619 | 616 | 607 | -1.4 | 4.6 |
| New Brunswick | 429 | 463 | 485 | 459 | 446 | -2.8 | 3.9 |
| Quebec | 8,012 | 8,671 | 8,770 | 8,617 | 8,416 | -2.3 | 5.0 |
| Ontario | 22,085 | 21,656 | 22,229 | 21,638 | 21,374 | -1.2 | -3.2 |
| Manitoba | 1,082 | 1,104 | 1,097 | 1,047 | 1,029 | -1.6 | -4.9 |
| Saskatchewan | 1,305 | 2,026 | 1,844 | 1,800 | 1,763 | -2.1 | 35.1 |
| Alberta | 5,288 | 6,072 | 5,974 | 6,087 | 5,972 | -1.9 | 12.9 |
| British Columbia | 4,538 | 4,592 | 4,544 | 4,472 | 4,413 | -1.3 | -2.7 |
| Yukon | 17 | 12 | 13 | 12 | 11 | -9.9 | -35.8 |
| Northwest Territories | 59 | 56 | 58 | 49 | 47 | -4.2 | -19.5 |
| Nunavut | 3 | 6 | 6 | 4 | 2 | -42.4 | -28.0 |