Building permits, April 2012

Archived Content
Information identified as archived is provided for reference, research or recordkeeping purposes. It is not subject to the Government of Canada Web Standards and has not been altered or updated since it was archived. Please "contact us" to request a format other than those available.
Related subjects
-
[an error occurred while processing this directive]
The total value of building permits fell 5.2% to $6.5 billion in April, following two consecutive monthly increases. The decline was largely the result of lower construction intentions for institutional buildings and multi-family dwellings in Ontario.
Total value of permits
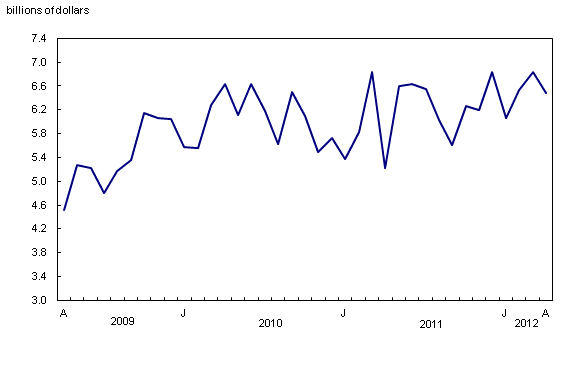
Chart description: Total value of permits
After two consecutive monthly advances, the value of permits in the non-residential sector decreased 8.4% to $2.7 billion. Non-residential construction intentions were down in six provinces; however, Ontario was behind most of the decline reported at the national level.
In the residential sector, the value of permits fell 2.8% to $3.8 billion in April, a fourth consecutive monthly decrease. April's decline was primarily attributable to lower construction intentions for multi-family dwellings in Ontario and single-family dwellings in Alberta.
Non-residential sector: Significant decline in the institutional component
In the institutional component, the value of building permits dropped 43.0% to $556 million. This decrease followed two consecutive monthly gains. April's decline came from six provinces, led by Ontario. The decline in Ontario was attributable to lower construction intentions for government buildings and medical facilities, which had been up substantially the previous month.
The value of commercial building permits rose 1.9% to $1.6 billion in April. It was the third consecutive monthly increase. The advance resulted from gains in four provinces, which offset the declines recorded in the remaining provinces. Alberta and British Columbia posted the largest increases, a result of higher construction intentions for office buildings, in particular. Quebec registered an advance that was mostly attributable to construction intentions for recreational facilities.
Industrial construction intentions rose 34.7% to $554 million, following a 42.4% decline in March. April's gain came from eight provinces, led by Quebec. The increase was the result of higher construction intentions, notably for transportation buildings and manufacturing plants.
Residential and non-residential sectors
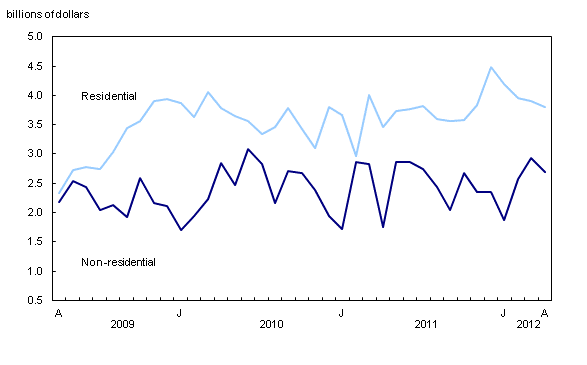
Chart description: Residential and non-residential sectors
Residential sector: Lower construction intentions for single-family and multi-family dwellings
Construction intentions for single-family units fell 2.0% to $2.2 billion in April, following three consecutive months of declines. The drop was largely the result of lower construction intentions in seven provinces, led by Alberta. In contrast, Ontario, Quebec and New Brunswick posted increases.
Municipalities issued $1.6 billion worth of building permits for multi-family dwellings in April, down 4.0%, after being practically unchanged in March. Construction intentions were down in three provinces, led by Ontario, then followed by Quebec and Nova Scotia. A significant decline in Ontario was enough to offset increases reported in the remaining provinces.
Canadian municipalities approved the construction of 16,484 new dwellings, down 7.3% from March. The number of permits issued for multi-family dwellings fell 9.5% to 9,704 units. The number of single-family dwellings decreased 4.0% to 6,780 units.
Provinces: Construction intentions down sharply in Ontario
In April, the total value of building permits declined in five provinces, led by Ontario, then followed by Newfoundland and Labrador, Manitoba and Nova Scotia.
The decrease recorded in Ontario resulted from lower construction intentions for institutional and commercial buildings and for multi-family dwellings. In Newfoundland and Labrador, the decline was largely attributable to lower construction intentions for commercial buildings and single-family dwellings. In Manitoba, a decrease in the value of building permits for commercial and industrial buildings and for single-family dwellings was behind the decline, while in Nova Scotia, decreases were reported in institutional, commercial and residential buildings.
In contrast, Quebec posted the largest gain, mainly as a result of higher construction intentions for industrial and commercial buildings. Alberta and British Columbia also advanced, a result of higher construction intentions for non-residential buildings and multi-family dwellings.
Lower permit values in most census metropolitan areas
The total value of permits declined in 19 of the 34 census metropolitan areas.
The largest decreases were in Toronto, St. John's and Edmonton. In Toronto, the decline was largely the result of building permits for institutional buildings and multi-family dwellings. In St. John's, the decrease was mainly attributable to lower construction intentions for commercial buildings. In Edmonton, the decline was mostly a result of construction intentions for single-family dwellings.
In contrast, the largest gains were in Calgary and Montréal. In Calgary, the advance was largely attributable to the commercial component. In Montréal, the increase came from higher construction intentions in both residential and non-residential sectors.
Note to readers
Unless otherwise stated, this release presents seasonally adjusted data, which facilitates comparisons by removing the effects of seasonal variations.
The Building Permits Survey covers 2,400 municipalities representing 95% of the population. It provides an early indication of building activity.
The communities representing the other 5% of the population are very small, and their levels of building activity have little impact on the total.
The value of planned construction activities shown in this release excludes engineering projects (for example, waterworks, sewers or culverts) and land.
For the purpose of this release, the census metropolitan area of Ottawa–Gatineau (Ontario/Quebec) is divided into two areas: Gatineau part and Ottawa part.
Revision
Preliminary data are provided for the current reference month. Revised data, based on late responses, are updated for the previous month.
Available without charge in CANSIM: tables CANSIM table026-0001 to 026-0008 and CANSIM table026-0010.
Definitions, data sources and methods: survey number survey number2802.
The April 2012 issue of Building Permits (Catalogue number64-001-X, free) will soon be available.
The May building permits data will be released on July 6.
For more information, contact Statistics Canada's National Contact Centre (toll-free 1-800-263-1136; 613-951-8116; infostats@statcan.gc.ca).
To enquire about the concepts, methods or data quality of this release, contact Mahamat Hamit-Haggar (613-951-0862), Investment, Science and Technology Division.
- Date modified: