
Chart 2
Wholesale sales up in three provinces in March
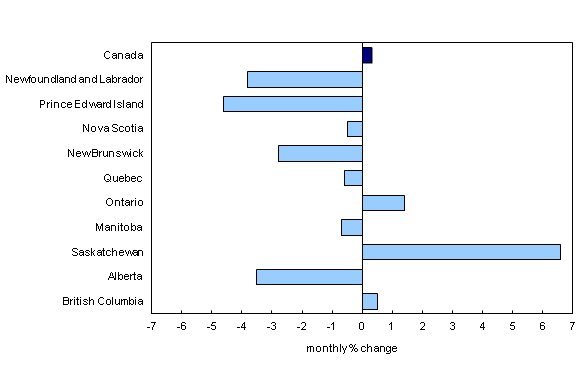
Chart description
The title of the graph is "Wholesale sales up in three provinces in March."
This is a bar clustered chart.
This is a horizontal bar graph, so categories are on the vertical axis and values on the horizontal axis.
There are in total 11 categories in the vertical axis. The horizontal axis starts at -7 and ends at 7 with ticks every 1 points.
There are 1 series in this graph.
The horizontal axis is "monthly % change."
The vertical axis is "Canada and provinces."
The title of series 1 is "Seasonally adjusted in current dollars."
The minimum value is -4.6 and it corresponds to "Prince Edward Island."
The maximum value is 6.6 and it corresponds to "Saskatchewan."
| monthly % change | |
|---|---|
| Canada | 0.3 |
| Newfoundland and Labrador | -3.8 |
| Prince Edward Island | -4.6 |
| Nova Scotia | -0.5 |
| New Brunswick | -2.8 |
| Quebec | -0.6 |
| Ontario | 1.4 |
| Manitoba | -0.7 |
| Saskatchewan | 6.6 |
| Alberta | -3.5 |
| British Columbia | 0.5 |
- Date modified: