Study: Measuring ecosystem goods and services
Archived Content
Information identified as archived is provided for reference, research or recordkeeping purposes. It is not subject to the Government of Canada Web Standards and has not been altered or updated since it was archived. Please "contact us" to request a format other than those available.
Released: 2013-11-29
Between 2000 and 2011, an area almost twice the size of the cities of Toronto, Montréal and Calgary combined was converted from agricultural and natural land to settled areas, according to a new study, "Measuring ecosystem goods and services in Canada," released today in Human Activity and the Environment. This article reported that the development of settled areas in and around cities and towns increased by 3,158 km2 over the 11-year period.
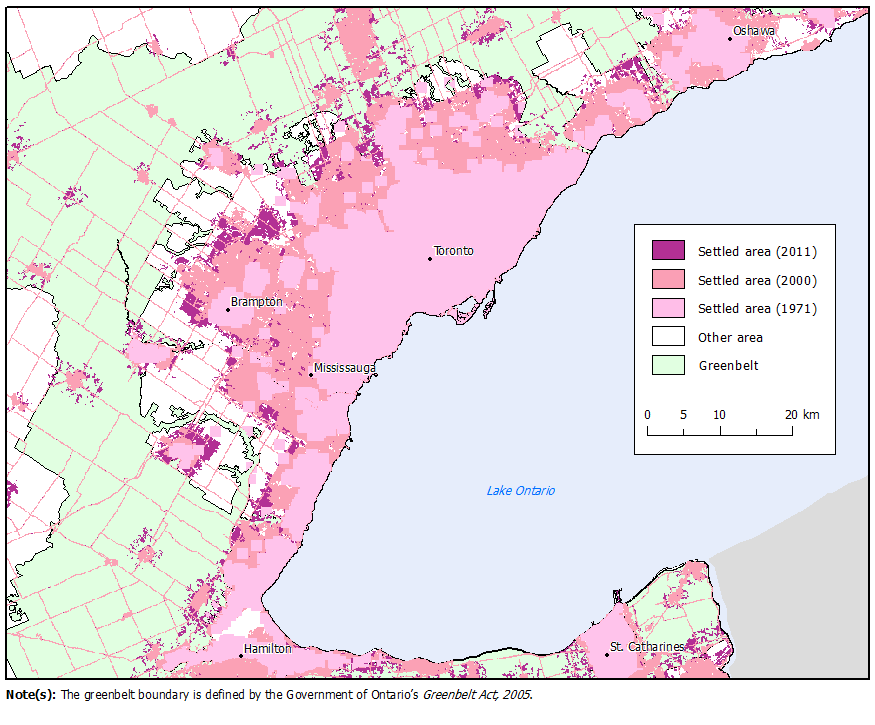
Regionally, the largest shift to settled area occurred in the Lake Ontario and Niagara Peninsula sub-drainage area (SDA), comprising 627 km2 (Map 1) mostly at the expense of agricultural land. Over this period, there was a 19% increase in the settled area occupying Canada's dependable agricultural land and a 29% increase on the very best Class 1 farmland.
These types of changes in land cover can influence the capacity of ecosystems to provide or contribute to the production of ecosystem goods and services (EGS). EGS are goods (for example, fish and timber) and services (for example, air and water purification) that provide benefits to people.
From 2001 to 2011, the largest changes in land cover at the national level occurred as agricultural land reverted to natural landscapes, in particular in the Qu'Appelle (3,674 km2), Assiniboine (2,658 km2), Lower South Saskatchewan (2,267 km2) and Lower North Saskatchewan (1,875 km2) SDAs. Conversely, large shifts from natural land to agricultural land occurred in the Upper South Saskatchewan SDA (1,468 km2) and Thompson SDA (973 km2).
Biomass extraction
In 2010, about 285.8 million tonnes of biomass were extracted from Canada's terrestrial and aquatic ecosystems. On a per capita basis, more than eight tonnes of organic materials, including timber, agricultural products and fish, were extracted from the environment. Forestry activities accounted for 55% of this total, followed by agricultural crops (40%), milk, maple and honey products (3%) and livestock and poultry (2%).
By weight, the largest proportion of biomass extraction occurred in British Columbia and Alberta, followed by Ontario and Quebec (Table 1). British Columbia accounted for the largest proportion of biomass extraction because of the predominance of forestry. Biomass extraction related to agriculture was highest in Alberta, Saskatchewan and Ontario. The Atlantic provinces accounted for the majority of biomass extraction from commercial fisheries.
Biomass extraction can place pressure on ecosystems, potentially reducing their ability to produce EGS in the future. Measuring this extraction is a step towards the development of indicators that help explain if human use of ecosystem goods is sustainable.
Marine and coastal ecosystem goods and services
Commercial landings of sea fisheries on Canada's Atlantic and Pacific coasts totalled over 850 000 tonnes and were valued at $2.1 billion in 2011. Fish and other marine and coastal EGS contribute to local economies and employment opportunities through harvesting and processing activities.
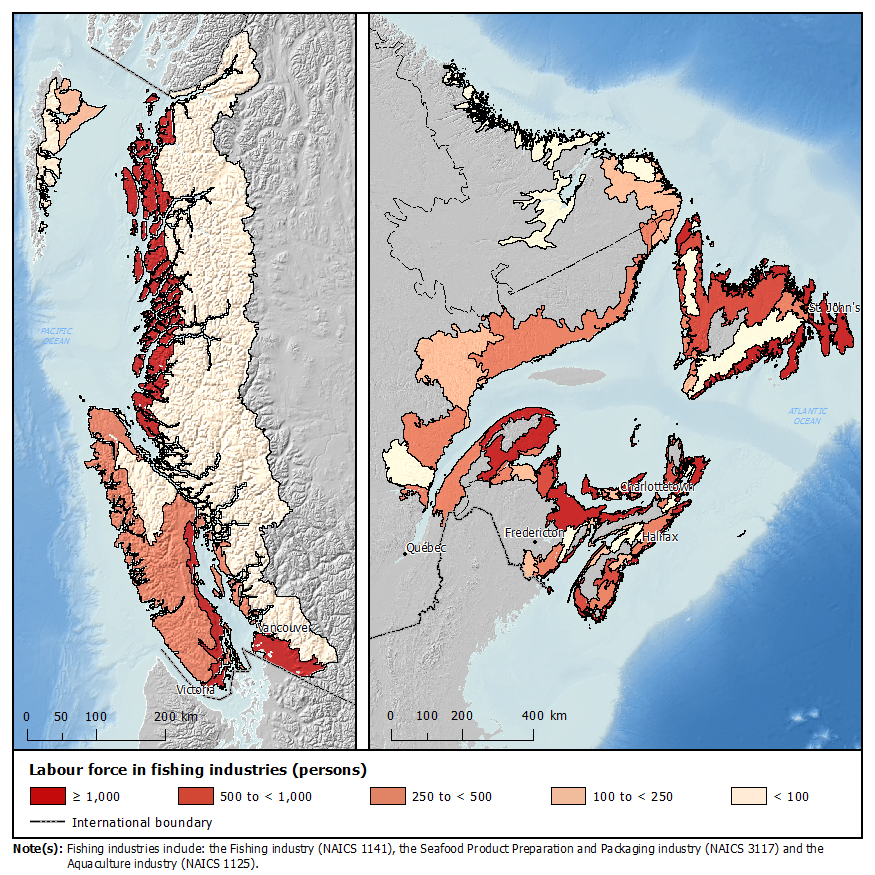
On the East Coast, commercial fishing, aquaculture and seafood processing activities accounted for 14% of employment in coastal ecodistricts where such activities were found in 2006 (Map 2). On the West Coast, the comparable figure was 4%.
In 2010, direct spending on recreational fishing trips by anglers was about $2.5 billion; many of these expenditures can be directly attributed to EGS (for example, fish, recreation).
Thousand Islands National Park case study
The Thousand Islands National Park, located within the Thousand Islands Ecosystem located in Eastern Ontario, was selected as a case study to measure the monetary value of EGS flows. The study also identified pressures on the landscape and determined the land cover of the area surrounding the park.
Over 200,000 people lived in the Thousand Islands Ecosystem in 2011, a 32% increase since 1981. From 1981 to 2011, the number of farms and the area of farmland decreased by 37% and 28% respectively.
Land cover for the Thousand Islands Ecosystem includes forest (31%), cropland and field (24%), water (22%), shrubland (11%), wetlands (7%) and built-up areas (6%).
Experimental estimates of the annual value of EGS flows assessed for the Thousand Islands National Park, such as water quality regulation and aesthetic services, range from $12.5 million to $14.7 million (2012 dollars). Recreational services were also valued, with an estimate of $3.9 million (2012 dollars) annually.
Note to readers
This release is based on the analytical report "Measuring ecosystem goods and services in Canada" in the 2013 edition of Human Activity and the Environment.
The report presents a compilation of preliminary results achieved through a two-year interdepartmental collaboration between Statistics Canada, Environment Canada, Agriculture and Agri-Food Canada, Fisheries and Oceans Canada, Natural Resources Canada, Parks Canada and Policy Horizons Canada. As such, it is a compendium of interdisciplinary research initiatives focused on improving the understanding of the value of ecosystem goods and services (EGS) using ecosystem accounting.
The report presents information on the quantity, quality and value of Canada's ecosystems and EGS. It provides an overview of ecosystem accounting and valuation and presents several measures of the quantity and quality of ecosystems and EGS. These measures focus on land cover, human landscape modification, ecosystem potential of the boreal forest, biomass extraction, marine and coastal EGS, and wetland EGS. The report also includes a case study on the Thousand Islands National Park exploring monetary valuation of EGS and concludes with a research agenda for future work on this topic.
Definitions
Several data compilations are presented by sub-drainage area (SDA). SDAs represent areas in which surface water is carried by a drainage system into a body of water. The SDA is a component of the Standard Drainage Area Classification, 2003.
Dependable agricultural land refers to land not hampered by severe constraints for crop production and includes Class 1, 2, and 3 lands in the Canada Land Inventory.
The Ontario Greenbelt Act, 2005, protects environmentally sensitive land and farmland in Southern Ontario's Golden Horseshoe region from urban development and sprawl.
Ecodistricts are areas characterized by distinctive assemblages of relief, fauna, water bodies, soils, landforms and geology and are the lowest level in The National Ecological Framework of Canada hierarchy.
The marine coastal fisheries ecumene consists of coastal areas at the ecodistrict level, in which selected employment activities related to the marine environment—commercial fishing, aquaculture and seafood processing—are found.
The study "Measuring ecosystem goods and services in Canada" is now available in the publication Human Activity and the Environment, 2013 (Catalogue number16-201-X). From the Browse key resource module of our website under Publications, choose All subjects, then Environment.
Contact information
For more information, contact us (toll-free 1-800-263-1136; 514-283-8300; infostats@statcan.gc.ca) or Media Relations (613-951-4636; statcan.mediahotline-ligneinfomedias.statcan@canada.ca).
For analytical information, or to enquire about the concepts, methods or data quality of this release, contact François Soulard (613-951-1777; francois.soulard@statcan.gc.ca). For information on Human Activity and the Environment, contact Jennie Wang (604-666-4878; jennie.wang@statcan.gc.ca), Environment Accounts and Statistics Division.
- Date modified:


