
5 Data Visualization
5.7 Histogram
Text begins
The histogram is a popular graphing tool. It is used to summarize discrete or continuous data that are measured on an interval scale. It is often used to illustrate the major features of the distribution of the data in a convenient form. It is also useful when dealing with large data sets (greater than 100 observations). It can help detect any unusual observations (outliers) or any gaps in the data.
A histogram divides up the range of possible values in a data set into classes or groups. For each group, a rectangle is constructed with a base length equal to the range of values in that specific group and a length equal to the number of observations falling into that group. A histogram has an appearance similar to a vertical bar chart, but there are no gaps between the bars. Generally, a histogram will have bars of equal width. Chart 5.7.1 is an example of a histogram that shows the distribution of salary, a continuous variable, of the employees of a corporation.
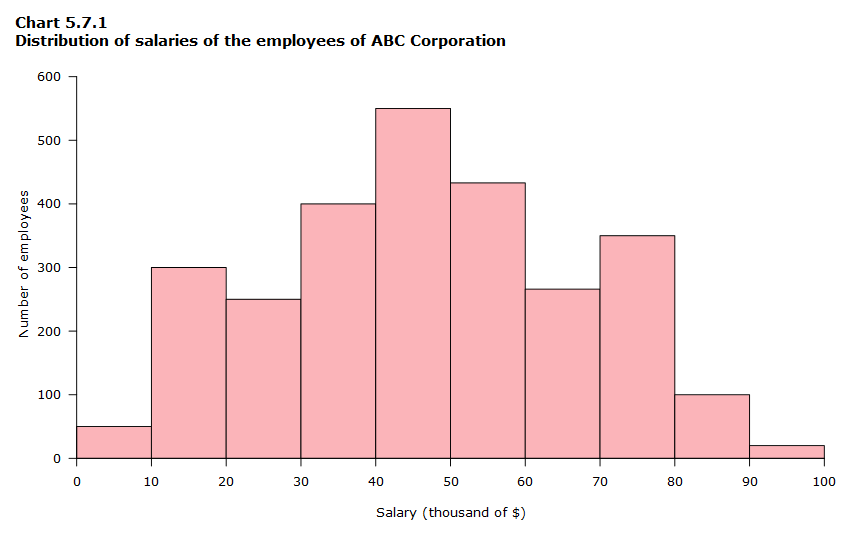
Data table for Chart 5.7.1
| Salary (in thousands of $) | Number of employees |
|---|---|
| 0–10 | 50 |
| 11–20 | 300 |
| 21–30 | 250 |
| 31–40 | 400 |
| 41–50 | 550 |
| 51–60 | 433 |
| 61–70 | 266 |
| 71–80 | 350 |
| 81–90 | 100 |
| 91+ | 20 |
The following table presents the differences between a histogram and vertical bar graph.
| Comparison terms | Bar chart | Histogram |
|---|---|---|
| Usage | To compare different categories of data. | To display the distribution of a variable. |
| Type of variable | Categorical variables | Numeric variables |
| Rendering | Each data point is rendered as a separate bar. | The data points are grouped and rendered based on the bin value. The entire range of data values is divided into a series of non-overlapping intervals. |
| Space between bars | Can have space. | No space. |
| Reordering bars | Can be reordered. | Cannot be reordered. |
- Date modified: