
Statement outlining results, risks and significant changes in operations, personnel and program
A) Introduction
Statistics Canada's mandate
Statistics Canada is a member of the Industry portfolio.
Statistics Canada's role is to ensure that Canadians have access to a trusted source of statistics on Canada that meets their highest priority needs.
The Agency's mandate derives primarily from the Statistics Act. The Act requires that the Agency collects, compiles, analyzes and publishes statistical information on the economic, social, and general conditions of the country and its people. It also requires that Statistics Canada conduct the census of population and the census of agriculture every fifth year, and protects the confidentiality of the information with which it is entrusted.
Statistics Canada also has a mandate to co-ordinate and lead the national statistical system. The Agency is considered a leader, among statistical agencies around the world, in co-ordinating statistical activities to reduce duplication and reporting burden.
More information on Statistics Canada's mandate, roles, responsibilities and programs can be found in the 2014–2015 Main Estimates and in the Statistics Canada 2014–2015 Report on Plans and Priorities.
The quarterly financial report
- should be read in conjunction with the 2014–2015 Main Estimates, and Canada's Economic Action Plan 2012 (Budget 2012);
- has been prepared by management, as required by Section 65.1 of the Financial Administration Act, and in the form and manner prescribed by Treasury Board;
- has not been subject to an external audit or review.
Statistics Canada has the authority to collect and spend revenue from other government departments and agencies, as well as from external clients, for statistical services and products.
Basis of presentation
This quarterly report has been prepared by management using an expenditure basis of accounting. The accompanying Statement of Authorities includes the Agency's spending authorities granted by Parliament and those used by the Agency consistent with the Main Estimates for the 2014–2015 fiscal year. This quarterly report has been prepared using a special purpose financial reporting framework designed to meet financial information needs with respect to the use of spending authorities.
The authority of Parliament is required before moneys can be spent by the Government. Approvals are given in the form of annually approved limits through appropriation acts or through legislation in the form of statutory spending authority for specific purposes.
The Agency uses the full accrual method of accounting to prepare and present its annual departmental financial statements that are part of the departmental performance reporting process. However, the spending authorities voted by Parliament remain on an expenditure basis.
B) Highlights of fiscal quarter and fiscal year-to-date results
This section highlights the significant items that contributed to the net decrease in resources available for the year, as well as actual expenditures for the quarter ended June 30.
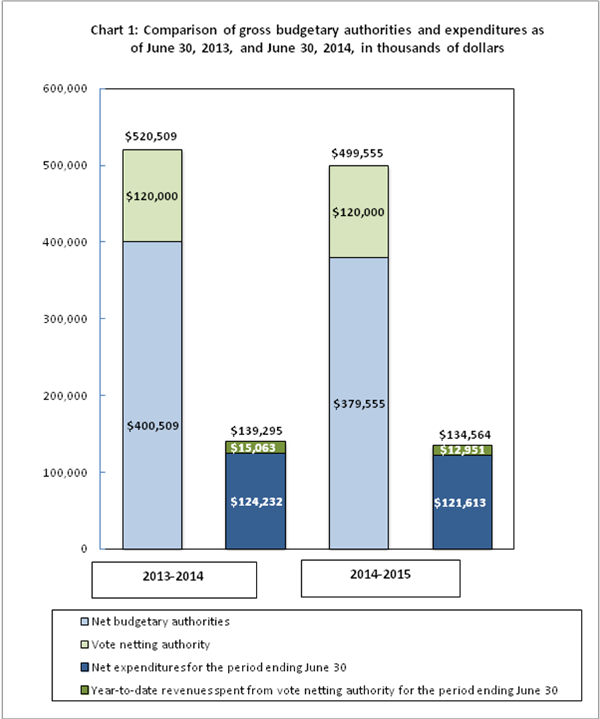
Chart 1 outlines the gross budgetary authorities, which represent the resources available for use for the year as of June 30.
Significant changes to authorities
Total authorities available for 2014–2015 have decreased by $20.9 million, or 4%, from the previous year, from $520.5 million to $499.6 million (Chart 1). This net decrease was mostly the result of the following:
- decrease for the 2011 Census of Population and the National Household Survey ($6.2 million) and the 2011 Census of Agriculture ($1.8 million), as the programs wind down;
- net reductions related to Budget 2012 saving measures ($15.6 million);
- decrease for the transfer of funds to Shared Services Canada for workplace technology device software ($1.6 million);
- partially offset by an economic increase for collective agreements ($5 million).
In addition to the appropriations allocated to the Agency through the Main Estimates, Statistics Canada also has vote net authority within Vote 105, which entitles the Agency to spend revenues collected from other government departments, agencies, and external clients to provide statistical services. Vote netting authority is stable at $120 million in each of the fiscal years 2013–2014 and 2014–2015.
Significant changes to expenditures
Year-to-date net expenditures recorded to the end of the first quarter decreased by $2.6 million, or 2%, from $124.2 million to $121.6 million. (See Table A: Variation in Departmental Expenditures by Standard Object.)
Statistics Canada spent approximately 27% of its authorities by the end of the first quarter, compared with 27% in the same quarter of 2013–2014.
| Departmental Expenditures Variation by Standard Object | Q1 year-to-date variation | |
|---|---|---|
| $'000 | % | |
| Note: Explanations are provided for variances of more than $1 million. | ||
| (01) Personnel | -18,130 | -13.9 |
| (02) Transportation and communications | -316 | -13.2 |
| (03) Information | 53 | 76.8 |
| (04) Professional and special services | 1,150 | 62.1 |
| (05) Rentals | 1,178 | 52.4 |
| (06) Repair and maintenance | 45 | 136.4 |
| (07) Utilities, materials and supplies | -98 | -20.9 |
| (08) Acquisition of land, buildings and works | - | - |
| (09) Acquisition of machinery and equipment | -2,011 | -91.5 |
| (10) Transfer payments | - | - |
| (12) Other subsidies and payments | 13,398 | 267,960.0 |
| Total gross budgetary expenditures | -4,731 | -3.4 |
| Less revenues netted against expenditures | ||
| Revenues | -2,112 | -14.0 |
| Total net budgetary expenditures | -2,619 | -2.1 |
01) Personnel: The decrease resulted from incurring expenditures for severance liquidations related to the signing of collective agreements in the first quarter of 2013–2014. These expenditures were partly offset by increased salary expenditures, resulting from annual increments and the signing of collective bargaining agreements.
04) Professional and special services: The increase resulted from increased spending on informatics services.
05) Rentals: The increase resulted from increased maintenance costs associated with additional database hosting licenses acquired.
09) Acquisition of machinery and equipment: The decrease resulted from acquiring computer equipment in the first quarter of 2013–2014.
12) Other subsidies and payments: The increase resulted from a one-time transition payment for implementing salary payment in arrears by the Government of Canada.
The decrease in revenues resulted primarily from timing differences between years for the receipt of funds and scheduled key deliverables.
C) Risks and uncertainties
In 2014–2015, Statistics Canada plans to continue monitoring budget pressures, including the cost-saving measures announced in Budget 2014, with the following actions and mitigation strategies:
- additional analysis, monitoring and validation of financial and human resources information through a modified monthly financial package for budget holders
- review of monthly project dashboards in place across the Agency to monitor project issues, risks and alignment with approved budgets
- continued realignment and reprioritization of work
In addition, Statistics Canada uses risk management and a risk-based decision-making process to prioritize and conduct its business. To do so effectively, the Agency identifies its key risks and develops corresponding mitigation strategies in its Corporate Risk Profile.
D) Significant changes to operations, personnel and programs
No significant changes in relation to operations, personnel and programs have occurred over the last quarter.
E) Budget 2012 implementation
This section provides an overview of the savings measures announced in Budget 2012 that are being implemented in order to refocus government and programs, make it easier for Canadians and businesses to deal with their government, as well as modernize and reduce the back office.
Statistics Canada's savings target as announced in Budget 2012 Economic Action Plan is $33.9 million by 2014–2015. This reduction is being implemented progressively, beginning with $8.3 million on April 1, 2012, rising to $18.3 million on April 1, 2013, in order to achieve the full reduction by April 1, 2014. The reductions, as of April 1, 2014, have been reflected in Statistics Canada's Main Estimates. To meet this target, Statistics Canada has focused resources where they are most needed.
The savings incurred through these program adjustments represent moderate reductions in the production of statistics to support development, administration, and evaluation of policy, while continuing to meet the public's highest priority needs. In some cases, the information will continue to be available in a different format. A full list of program adjustments is available online.
There are no financial risks or uncertainties related to these reductions.
Approval by senior officials
The original version was signed by
Wayne R. Smith, Chief Statistician
Stéphane Dufour, Chief Financial Officer
Date signed August 21, 2014
| Fiscal year 2014-2015 | |||
|---|---|---|---|
| Planned expenditures for the year ending March 31, 2015 | Expended during the quarter ended June 30, 2014 | Year to date used at quarter-end | |
| in thousands of dollars | |||
| Expenditures | |||
| (01) Personnel | 401,121 | 111,901 | 111,901 |
| (02) Transportation and communications | 25,808 | 2,075 | 2,075 |
| (03) Information | 2,509 | 122 | 122 |
| (04) Professional and special services | 35,680 | 3,001 | 3,001 |
| (05) Rentals | 13,154 | 3,426 | 3,426 |
| (06) Repair and maintenance | 7,044 | 78 | 78 |
| (07) Utilities, materials and supplies | 13,241 | 370 | 370 |
| (08) Acquisition of land, buildings and works | - | - | - |
| (09) Acquisition of machinery and equipment | 825 | 188 | 188 |
| (10) Transfer payments | - | - | - |
| (12) Other subsidies and payments | 173 | 13,403 | 13,403 |
| Total gross budgetary expenditures | 499,555 | 134,564 | 134,564 |
| Less revenues netted against expenditures | |||
| Revenues | 120,000 | 12,951 | 12,951 |
| Total revenues netted against expenditures | 120,000 | 12,951 | 12,951 |
| Total net budgetary expenditures | 379,555 | 121,613 | 121,613 |
| Fiscal year 2013-2014 | |||
|---|---|---|---|
| Planned expenditures for the year ending March 31, 2014 | Expended during the quarter ended June 30, 2013 | Year-to-date used at quarter-end | |
| in thousands of dollars | |||
| Expenditures | |||
| (01) Personnel | 419,449 | 130,031 | 130,031 |
| (02) Transportation and communications | 26,173 | 2,391 | 2,391 |
| (03) Information | 2,656 | 69 | 69 |
| (04) Professional and special services | 33,940 | 1,851 | 1,851 |
| (05) Rentals | 9,224 | 2,248 | 2,248 |
| (06) Repair and maintenance | 11,951 | 33 | 33 |
| (07) Utilities, materials and supplies | 12,355 | 468 | 468 |
| (08) Acquisition of land, buildings and works | - | - | - |
| (09) Acquisition of machinery and equipment | 4,586 | 2,199 | 2,199 |
| (10) Transfer payments | - | - | - |
| (12) Other subsidies and payments | 175 | 5 | 5 |
| Total gross budgetary expenditures | 520,509 | 139,295 | 139,295 |
| Less revenues netted against expenditures | |||
| Revenues | 120,000 | 15,063 | 15,063 |
| Total revenues netted against expenditures | 120,000 | 15,063 | 15,063 |
| Total net budgetary expenditures | 400,509 | 124,232 | 124,232 |
| Fiscal year 2014-2015 | |||
|---|---|---|---|
| Total available for use for the year ending March 31, 2015* | Used during the quarter ended June 30, 2014 | Year to date used at quarter-end | |
| in thousands of dollars | |||
| * Includes only authorities available for use and granted by Parliament at quarter-end. | |||
| Vote 105 – Net operating expenditures | 322,744 | 107,410 | 107,410 |
| Statutory authority – Contribution to employee benefit plans | 56,811 | 14,203 | 14,203 |
| Total budgetary authorities | 379,555 | 121,613 | 121,613 |
| Fiscal year 2013-2014 | |||
|---|---|---|---|
| Total available for use for the year ended March 31, 2014* | Used during the quarter ended June 30, 2013 | Year to date used at quarter-end | |
| in thousands of dollars | |||
| * Includes only authorities available for use and granted by Parliament at quarter-end. | |||
| Vote 105 – Net operating expenditures | 338,342 | 108,690 | 108,690 |
| Statutory authority – Contribution to employee benefit plans | 62,167 | 15,542 | 15,542 |
| Total budgetary authorities | 400,509 | 124,232 | 124,232 |