
Data table for the graph
| Number of payroll employees (thousands) |
Proportion of payroll employees (%) |
|
|---|---|---|
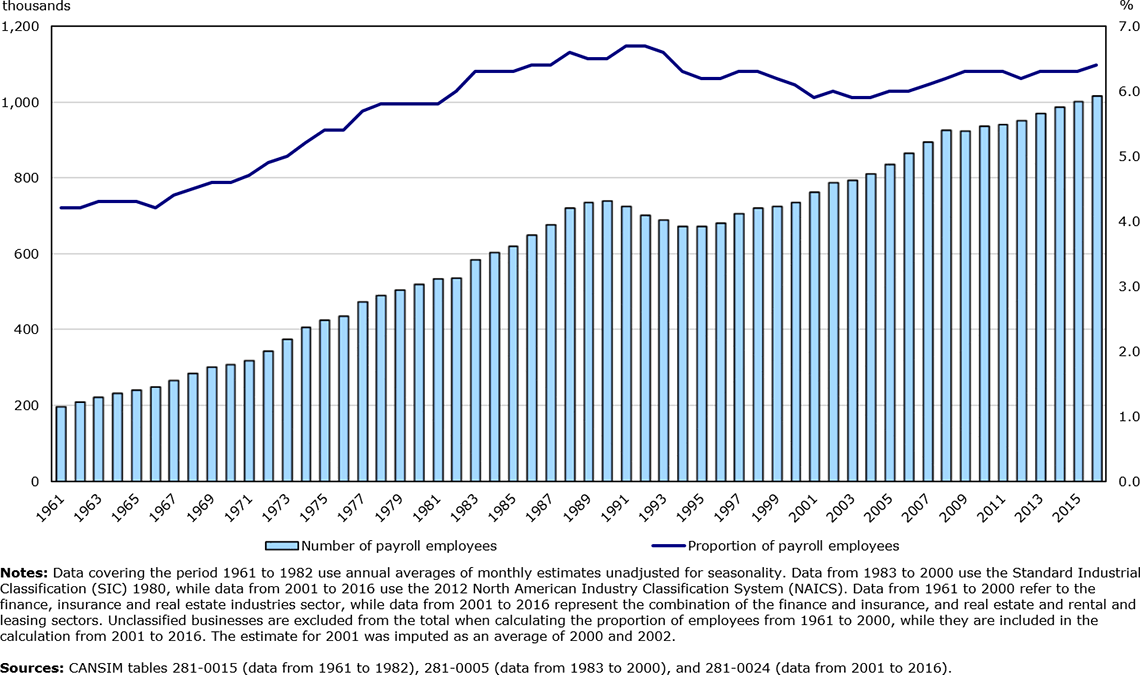
| 1961 | 196.2 | 4.2 |
| 1962 | 207.5 | 4.2 |
| 1963 | 220.0 | 4.3 |
| 1964 | 231.8 | 4.3 |
| 1965 | 240.6 | 4.3 |
| 1966 | 248.7 | 4.2 |
| 1967 | 265.7 | 4.4 |
| 1968 | 282.7 | 4.5 |
| 1969 | 299.6 | 4.6 |
| 1970 | 305.8 | 4.6 |
| 1971 | 316.4 | 4.7 |
| 1972 | 342.8 | 4.9 |
| 1973 | 373.3 | 5.0 |
| 1974 | 405.5 | 5.2 |
| 1975 | 423.2 | 5.4 |
| 1976 | 434.4 | 5.4 |
| 1977 | 472.1 | 5.7 |
| 1978 | 488.2 | 5.8 |
| 1979 | 502.4 | 5.8 |
| 1980 | 517.2 | 5.8 |
| 1981 | 533.1 | 5.8 |
| 1982 | 534.7 | 6.0 |
| 1983 | 582.7 | 6.3 |
| 1984 | 602.2 | 6.3 |
| 1985 | 617.9 | 6.3 |
| 1986 | 647.8 | 6.4 |
| 1987 | 675.4 | 6.4 |
| 1988 | 719.0 | 6.6 |
| 1989 | 733.1 | 6.5 |
| 1990 | 737.4 | 6.5 |
| 1991 | 722.3 | 6.7 |
| 1992 | 700.1 | 6.7 |
| 1993 | 688.0 | 6.6 |
| 1994 | 670.5 | 6.3 |
| 1995 | 670.0 | 6.2 |
| 1996 | 679.9 | 6.2 |
| 1997 | 704.2 | 6.3 |
| 1998 | 718.5 | 6.3 |
| 1999 | 723.1 | 6.2 |
| 2000 | 734.5 | 6.1 |
| 2001 | 760.3 | 5.9 |
| 2002 | 786.0 | 6.0 |
| 2003 | 792.3 | 5.9 |
| 2004 | 808.6 | 5.9 |
| 2005 | 833.0 | 6.0 |
| 2006 | 863.0 | 6.0 |
| 2007 | 893.2 | 6.1 |
| 2008 | 923.2 | 6.2 |
| 2009 | 922.6 | 6.3 |
| 2010 | 934.3 | 6.3 |
| 2011 | 939.3 | 6.3 |
| 2012 | 948.9 | 6.2 |
| 2013 | 967.8 | 6.3 |
| 2014 | 985.1 | 6.3 |
| 2015 | 999.7 | 6.3 |
| 2016 | 1013.9 | 6.4 |
|
Notes: Data covering the period 1961 to 1982 use annual averages of monthly estimates unadjusted for seasonality. Data from 1983 to 2000 use the Standard Industrial Classification (SIC) 1980, while data from 2001 to 2016 use the 2012 North American Industry Classification System (NAICS). Data from 1961 to 2000 refer to the finance, insurance and real estate industries sector, while data from 2001 to 2016 represent the combination of the finance and insurance, and real estate and rental and leasing sectors. Unclassified businesses are excluded from the total when calculating the proportion of employees from 1961 to 2000, while they are included in the calculation from 2001 to 2016. The estimate for 2001 was imputed as an average of 2000 and 2002. Sources: CANSIM tables 281-0015 (data from 1961 to 1982), 281-0005 (data from 1983 to 2000), and 281-0024 (data from 2001 to 2016). |
||