Feature article
The Output Gap between Canada and the US: The Role of Productivity 1994-2002
by J. Baldwin and J.-P. Maynard*
Introduction
Comparisons of Canada’s economy with the United States are done for several purposes. On the one hand, analysts are interested in whether there is an output gap between the two countries—whether Canada is as well off as the United States in terms of the quantities of goods and services per capita. On the other hand, analysts ask whether there is a productivity gap—whether Canada is equally efficient in transforming the resources used in the production process into goods and services.
Determining the answers to both these questions is complex because of the size and diversity of the two economies. The Canadian and US economies produce a variety of goods and services and intercountry comparisons require the creation of a single (or a small) number of summary statistics that encapsulate differences between the two countries.
In this paper, we use two separate but related measures to investigate the size of the output and productivity gaps between the two countries over the period from 1994 to 2002 and ask how they are related. We do so in order not only to describe the differences between Canada and the United States but also to ask whether the two measures provide the same story. We show that they do not and explain why.
The framework
Many analysts use GDP as a summary statistic since it aggregates a wide range of goods and services into one value—using market prices as the aggregator.1 And to account for differences in the population in the two countries, GDP is divided by an estimate of population to yield GDP per capita.
In contrast, measuring the efficiency of an economy is often accomplished by using a summary statistic calculated as the size of GDP relative to the effort of labour that is used to produce it. Labour input is most commonly measured by hours worked. The summary statistic that is then employed is GDP per hour worked, better known as labour productivity.
GDP per capita and GDP per hour worked are often used interchangeably. Some observers use GDP per capita as an indicator of efficiency or productivity. Others use output per hour as an indicator of our standard of living. While productivity growth rates are at the heart of changes in our standard of living, they are not the only factor at work.
We have previously pointed out that while changes in the two measures are correlated, there can be substantial short-run deviations in one measure from the other (Wells, Baldwin and Maynard, 1999). And productivity growth is not always perfectly correlated with wages or profits. A manager knows that efficiency can be increased, but profits may decline if prices fall, forcing down wages. The same can happen for a nation. Canada may produce resources like oil or nickel more efficiently than other nations, but if export prices fall, profits and wages may stagnate. Similarly, a commodity price boom can push prices up and rapidly improve profitability without being accompanied by any acceleration in productivity growth.
While the summary statistics that are used to inform discussion of these two issues are different, they are related. To see this, note that
GDP/Pop=(GDP/Hours)*(Hours/Emp)*(Emp/Pop)
where GDP is gross domestic product
Pop is population
Hours is hours worked
Emp is jobs or employment.
This identity shows that GDP per capita is equal to the product of labour productivity (GDP/Hours), effort (the hours worked per job (or per employee)), and the employment rate (the ratio of the number of employees (or jobs) to the total population). Or rewriting
GDPCAP=PROD*EFFORT*EMP
The amount available for consumption per person in a country (GDPCAP) will be higher when productivity (PROD) is higher, when employees work longer hours (EFFORT), and when a larger proportion of the population is employed (EMP).
In Wells, Baldwin and Maynard (1999), we showed that productivity growth in Canada was very similar in the period 1979-88 and the period 1988-97, but that growth in GDP per capita varied substantially over the two periods. Despite the similarities in the growth of labour productivity in the two periods, growth in GDP per capita was much higher in the first period because there was positive growth in the variable EMP (the proportion of the population who were employed) in the former period but a decline in the latter.
The relative level of GDP per capita and labour productivity can also differ across countries for much the same reasons. To see this, note that the ratio of GDP per capita in Canada to GDP per capita in the United States can be divided into several components.
GDPCAPcan/GDPCAPus=[PRODcan/PRODus]
*[EFFORTcan/EFFORTus]*[EMPcan/EMPus]
Differences in GDP per capita then will exist if there are differences in productivity, in effort and in the employment rate. Only the first component captures differences in productivity. The latter two capture differences in aspects of the labour market. Differences in hours worked per employee arise because of differences in the demand for labour, differences in the inclination of the labour force to work longer hours or differences in regulations. For example, France has legislated a 35 hour work week that restricts the number of hours that can be worked per week. Differences in employment rates between two countries depend upon differences in the economic health of the two economies as well as demographic characteristics. In the latter case, differences across countries in birth rates will have an impact on the relative proportion of the total population in working age groups.
The empirical evidence
In this section, we examine differences in the level of GDP per capita between Canada and the United States and differences in labour productivity in the late 1990s. We also estimate the percentage of the difference in GDP per capita between Canada and the United States that arises from differences in productivity.
For this exercise, we will examine the total economy of both countries. We therefore combine both the business and the government and non-profit sectors to obtain measures of GDP.
Hours worked and jobs are obtained from a forthcoming study that examines the relative level of productivity in the two countries (Baldwin, Maynard, Tanguay, Wong, and Yan, 2005).2 The productivity programs of Statistics Canada and the Bureau of Labor Statistics make use of different methodologies when they calculate hours worked. For cross-country comparisons of productivity growth, these differences are not very important. But for comparisons of levels, these differences matter considerably. Therefore, for the purpose of comparing levels, we have reestimated the US data on hours using the Canadian methodology.3
For our comparison, we divide the effort variable into hours worked per job and the number of jobs per potential member of the labour force. The potential labour force is defined as those who are 15 and over. While it might be argued that the elderly should be excluded from this definition, it is difficult to choose a particular age (i.e., 65) where we arbitrarily designate individuals as unemployable. Choosing a lower bound is facilitated by mandated education requirements.
Estimates of GDP for the total economy are taken from official estimates. Both countries generally adhere to international standards. While there are some minor differences, they are not regarded as a major problem for Canada/US comparisons at the level of the total economy.4
For comparisons of GDP in Canada and the United States, a deflator must be chosen to allow us to compare estimates of GDP that are produced in different currencies. For the purpose of this paper, we use the purchasing power parity indices that are produced by Statistics Canada to compare expenditures across countries (Statistics Canada, 2002). While this measure is somewhat imperfect, variants tend to increase the value of Canada’s labour productivity relative to that of the United States. For simplicity, we make use of the traditional estimate here.
The ratios needed are estimated for the period 1994-2002 and presented in Table 1. These include GDP per capita, labour productivity, effort and employment rates for Canada relative to the United States. We divide the effort variable into two components—the number of hours per job and the number of jobs per member of the potential labour force (population of age 15 and over).
Table 1: Canada relative to the US
| Year |
GDP per Capita |
Labour Productivity |
Hours Worked per Job |
Jobs to Population* |
Working age population* to population |
Hours Worked per Capita |
| 1994 |
82.2 |
93.1 |
95.3 |
90.9 |
101.9 |
88.3 |
| 1995 |
82.7 |
94.0 |
95.4 |
90.4 |
102.0 |
88.0 |
| 1996 |
81.9 |
93.9 |
95.3 |
89.6 |
102.1 |
87.2 |
| 1997 |
81.5 |
93.7 |
94.9 |
89.6 |
102.3 |
86.9 |
| 1998 |
82.4 |
94.4 |
94.7 |
90.0 |
102.4 |
87.3 |
| 1999 |
82.8 |
93.6 |
94.6 |
91.0 |
102.7 |
88.4 |
| 2000 |
84.8 |
95.8 |
93.9 |
91.6 |
102.9 |
88.5 |
| 2001 |
85.6 |
95.6 |
93.9 |
92.4 |
103.1 |
89.5 |
| 2002 |
86.2 |
93.8 |
93.5 |
95.3 |
103.2 |
91.9 |
| |
|
|
|
|
|
|
| Mean |
83.3 |
94.2 |
94.6 |
91.2 |
102.5 |
88.5 |
| * Aged 15 and over |
|
Over the period, GDP per capita in Canada averaged only 83.3% of GDP per capita in the United States (Figure 1). The output gap between the two countries was 17.7% of the US GDP per capita. But the gap between Canadian and US in labour productivity was much less—at only 5.8% of the US level. The difference in labour productivity accounted for only about 33% of the total percentage point difference in the GDP per capita of the two countries.5 That is, if effort was the same in the two countries, two thirds of the difference in GDP per capita would disappear.
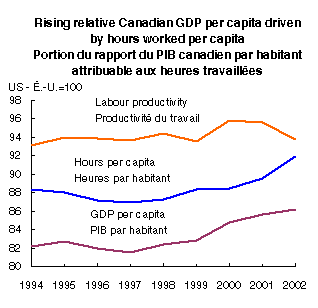
Figure 1

Most of the Canada/US difference in GDP per capita comes from differences in the labour input (hours worked per capita in the two countries). Hours worked per capita in Canada were only 88.5% of the hours worked per capita in the United States. This variable can be decomposed into three components—the differences in hours worked per job, the difference in jobs per potential member of the labour force and the ratio of the potential labour force to total population. Substantial differences between Canada and the United States exist in each of the former two areas. Hours worked per job in Canada are only 95% of those in the United States. Jobs per potential member of the labour force are 91% of the United States. Thus the primary reason that Canada has a lower GDP per capita than the United States is that those who work put in fewer hours per job and because Canadians are less likely to work at a job. It is not primarily because Canada is less productive.
The course of relative Canada/US GDP per capita, labour productivity and hours worked per capita over the period 1994-2002 is plotted in Figure 2. GDP per capita increased over the period from 82% to 86%. But relative Canadian labour productivity was the same at the beginning and end of the period at close to 94%. The increase in Canadian GDP per capita relative to the United States was due to increases in the hours worked per capita in Canada relative to the hours worked per capita in the United States. The Canada/US ratio of the number of hours worked per capita increased from 87% in 1997 to reach a peak of 92% in 2002. This was mainly due to an increase in the extent to which the economy was providing jobs. The Canada/US ratio of the number of jobs worked by the population above age 15 increased from 88% to 92% over the same period.
Figure 2
Conclusion
The primary reason for differences in the late 1990s between Canada and the United States in GDP per capita was not a difference in labour productivity; rather it was the difference in hours worked per capita. And the progress that has been made since the mid 1990s in closing the Canada/US GDP per capita gap came not from improvements in productivity, but from improvements in the hours worked per capita in Canada relative to the United States. The latter was because of a relatively faster increase in the number of jobs and employment in Canada.
Appendix
The main body of the paper uses jobs to calculate employment rates because it is this concept that has been defined in the System of National Accounts as the appropriate labour concept to be employed in conjunction with National Income concepts. For the purposes of international comparability, we adopt this standard.
An alternate measure that is sometimes employed is the number of individuals who hold jobs—or people employed. We calculate this measure from our reconciled United States/Canada data bases. The results are reported in Table A1.
Table A1: Alternate decomposition using employment Canada/United States relatives (%)
| Year |
Gross domestic product per capita |
Labour productivity |
Hours worked per employee |
Employment to potential labour force |
Potential labour force to population |
Hours worked per capita |
| 1994 |
82.2 |
93.1 |
94.3 |
91.9 |
101.9 |
88.3 |
| 1995 |
82.7 |
94.0 |
94.1 |
91.7 |
102.0 |
88.0 |
| 1996 |
81.9 |
93.9 |
94.3 |
90.6 |
102.1 |
87.2 |
| 1997 |
81.5 |
93.7 |
93.9 |
90.5 |
102.3 |
86.9 |
| 1998 |
82.4 |
94.4 |
93.9 |
90.8 |
102.4 |
87.3 |
| 1999 |
82.8 |
93.6 |
94.0 |
91.6 |
102.7 |
88.4 |
| 2000 |
84.8 |
95.8 |
93.4 |
92.1 |
102.9 |
88.5 |
| 2001 |
85.6 |
95.6 |
93.5 |
92.9 |
103.1 |
89.5 |
| 2002 |
86.2 |
93.6 |
93.3 |
95.4 |
103.2 |
91.9 |
| |
|
|
|
|
|
|
| Mean |
83.3 |
94.2 |
93.9 |
91.9 |
102.5 |
88.5 |
|
We derive the results reported here because we calculate jobs using the Labour Force Survey (LFS) for Canada, and we use essentially the Current Employment Statistics (CES) data that are produced by the United States. Other studies sometimes make use of jobs estimates from the United States Current Population Survey (CPS).
An accompanying paper (Baldwin et al., 2005) provides more detail on the differences between the United States CES and the CPS. We believe that for deriving comparable jobs estimates, it is best to use the Canadian LFS estimates and the US CES estimates adjusted by some estimates derived from the CPS estimates of categories not covered by the CES. The Canadian LFS provides the most comprehensive estimate for jobs in Canada and is regarded as the best source for total jobs by the Canadian statistical authorities. The same is not true in the United States. The CPS has been late in benchmarking to population estimates throughout the 1990s and is consistently lower than the CES estimates.
References
Baldwin, J.R. J.P. Maynard, M. Tanguay, F. Wong, and B. Yan. 2005. A Comparison of Canadian and U. S. Productivity Levels: An Exploration of Measurement Issues. Economic Analysis Research Papers (forthcoming). Ottawa: Statistics Canada.
Maynard, J.-P. 2004. Annual measure of the volume of work consistent with the SNA: the Canadian experience, Paper presented to the Paris Group annual meeting in Lisbon, Portugal in September 2004.
Statistics Canada. 2002. Purchasing Power Parities and Real Expenditures, United States and Canada, 1992-2001. System of National Accounts. Catalogue No. 13-604. Ottawa.
Wells, S., J.R. Baldwin, and JP Maynard. 1999. “Productivity Growth in Canada and the United States,” Canadian Economic Observer, September 1999. Recent feature articles
* Director, Micro-Economic Analysis Division (613) 951-8588 or baldjoh@statcan.ca
1. It may involve other comparisons as well—the distribution of income, the amount of specific goods such as health care, etc. We restrict ourselves in this note to the measure of GDP only—a measure that brings together all of the goods and services produced by the economy.
2. An alternate measure of labour input is number employed. The results with this numeraire rather than jobs are presented in Appendix Table A1.
3. See Baldwin et al., 2005.
4. There are differences in specific industries that need to be considered when detailed comparisons are made at the industry level.
5. And as the forthcoming paper (Baldwin et al., 2005) indicates, the actual difference in productivity levels is probably less than the estimate used here.
|


