Import content rises with the loonie
The rapid appreciation of the Canadian dollar after 2002 appears to be slowly inducing firms to use more imports. The loonie rose from an average of US 63.7 cents in 2002 to 76.8 cents in 2004 (one-third of its eventual climb to parity with the US greenback late in 2007). While only 13 of 59 industries raised the import content of exports between 2000 and 2002, 15 did between in 2003 and 20 in 2004 as the dollar turned up. As a result, the overall import content of exports edged up from 27.1% in 2003 to 27.3% in 2004, its first rise in current dollars since 1998. The volume of imported inputs rose even faster as the rising dollar lowered import prices.
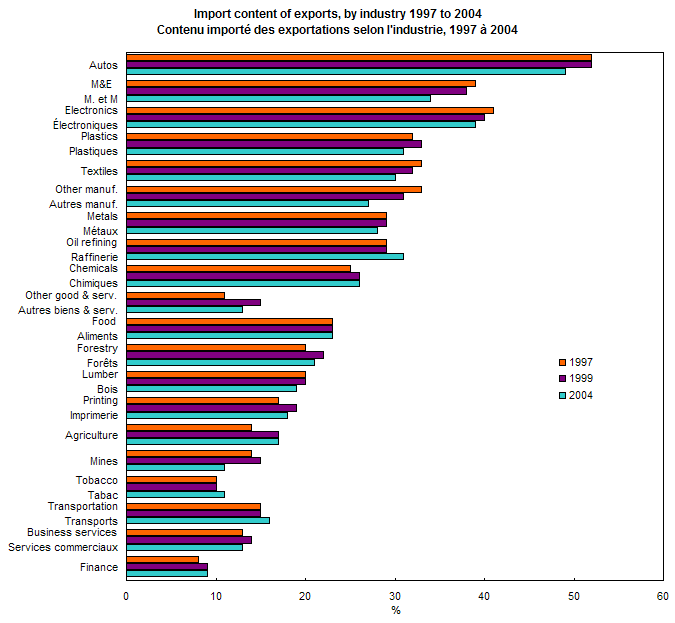
Of the 19 industries that boosted their use of imported inputs to make exports after 2002, it is probably no coincidence that a majority were in manufacturing (8) or transportation (2). These sectors faced the strongest competitive or cost pressures from the rising loonie and soaring oil prices starting late in 2002. These industries include transportation equipment, furniture, primary metals, metal fabricating, leather, chemicals, plastics and rubber, electrical equipment, trucking and sightseeing.10
Of the other 9 industries that raised import use, at least three also were adversely affected by the rising dollar, including the motion picture industry11, forestry and services for forestry and farming. Two others were related to health care and hospitals, where rising costs were squeezing budgets. Overall, most industries using more imported inputs after 2002 faced the largest need to search out lower costs and improve efficiency.
Not all manufacturers facing intense pressure from the exchange rate (among other factors) increased their use of imports: this group includes textiles and clothing. Textiles and clothing have traditionally been among the leaders in using imported inputs to lower the cost of production. Their sharp drop in import use after 2002 may reflect the closing of numerous mills and factories, sometimes as production was shifted completely to overseas countries. In these cases, the demand for intermediate inputs would have dropped to zero.
Exports’ share of GDP declined
The share of gross exports in nominal GDP hit a record high of 45.6% in 2000, at the peak of the high-tech boom. Since then, gross exports fell to 38.4% of GDP in 2004. This drop of 7.2 points was split equally between a decline in the share of value-added exports in GDP and a falling import content of exports.
Subtracting out the import content of exports leaves the share of value-added exports in GDP. This shows that 27.9% of GDP came from exports in 2004. This was down from its peak of 31.4% in 2000, and close to its recent low in 1997. It is well below the often-quoted but misleading share of gross exports in GDP, which peaked at 46% in 2000 before settling at about 38% in 2003 and 2004.
Since 2004, gross exports as a share of GDP fell another 1.9 points to 36.3% in 2006, largely due to lower prices. This suggests that the share of value-added exports in GDP is about 27%, assuming the drop in gross exports continued to be evenly split between lower imports and value-added exports. With exports to the US currently accounting for 75% of all Canada’s exports, this implies that about 20% of our output is exposed to the risk from the slowdown in US growth. The share of jobs would be even lower, as exports remain a sector with above-average output-per-worker.
Figure 3

As the share of exports in GDP has fallen, exports have been less of a destabilizing influence in GDP after 1999 than before. The ratio of the standard deviation of annual real export growth to real GDP growth was 1.4 (3.1 versus 2.2) in the 1990s (a ratio of 1.0 would reflect perfect synchronisation between changes in exports and GDP).12 However, this ratio rose to 3.5 between 2000 and 2007, as the standard deviation of exports rose to 3.5 while GDP’s fell to just 1.0: as export volatility increased, the volatility of output fell sharply.
Table 1 Exports in GDP
| |
Share of exports in GDP |
Import content of exports |
Share of value- added exports in GDP |
| |
% |
| 1986 |
27.9 |
26.0 |
20.6 |
| 1987 |
26.8 |
23.0 |
20.7 |
| 1988 |
26.7 |
24.0 |
20.3 |
| 1989 |
25.7 |
24.0 |
19.5 |
| 1990 |
25.8 |
24.0 |
19.6 |
| 1991 |
25.1 |
24.0 |
19.1 |
| 1992 |
27.1 |
26.0 |
20.0 |
| 1993 |
30.2 |
28.0 |
21.7 |
| 1994 |
34.0 |
30.0 |
23.8 |
| 1995 |
37.3 |
30.0 |
26.1 |
| 1996 |
38.4 |
30.0 |
26.9 |
| 1997 |
39.5 |
30.8 |
27.3 |
| 1998 |
41.4 |
31.6 |
28.3 |
| 1999 |
43.2 |
31.6 |
29.5 |
| 2000 |
45.6 |
31.2 |
31.4 |
| 2001 |
43.5 |
29.1 |
30.9 |
| 2002 |
41.6 |
28.7 |
29.6 |
| 2003 |
38.1 |
27.1 |
27.8 |
| 2004 |
38.4 |
27.3 |
27.9 |
| 2005 |
37.8 |
.. |
.. |
| 2006 |
36.3 |
.. |
.. |
| .. not available for a specific reference period. |
|
The increasing gap between the variability of exports and GDP reflects several factors, two of which are highlighted in this paper. First, the share of exports in GDP has been falling. And second, imports account for about one-third of exports, cushioning the impact of fluctuations in exports on domestic output. Other factors include significantly stronger domestic spending as the commodity boom boosted incomes in recent years, while better inventory control has helped stabilize real GDP.
Imported inputs and productivity
Changes in the use of imports by exporters broadly parallel changes in productivity in Canada. The increase in the use of imported parts in the 1990s accompanied rapid growth in labour productivity of 1.9% a year as firms restructured in the face of recession and free trade. Since 2000, the use of imports declined, and annual productivity growth has averaged 1.1% (its long-term average increase since 1961 was 2.1%).
This points to the falling use of imports in producing exports as one of many factors that help explain the recent slump in productivity that puzzled analysts and policy-makers early in 2007. Last year, we examined this slump in more detail, suggesting it was driven by labour shortages and the rapid shift of labour and capital to the booming resource sector.13 The results in this paper suggest that the reduced willingness of firms in Canada to use imports in their production process also may have contributed to the slowdown in productivity growth after 2000.
Imports for intermediate and final use
The drop in imports destined to be embedded in exports also contributed to a shift in the composition of Canada’s imports. Overall, imports destined to be intermediate inputs into production fell from 21.1% of all imports in 2000 to 17.8% in 2004. Most of this decrease originated in imports14 needed to produce exports, which fell from 12.1% to 9.1% in 2004. This reflected both the lower import content of exports and a slight drop in exports in absolute terms over that period. Meanwhile the share of imports used as inputs for production for the domestic market was steady at about 9%.
Figure 4

Instead, the most rapidly growing part of imports has been those destined directly for purchase by consumers and businesses (the latter was mostly investment goods). These accounted for 82.2% of goods imports in 2004, up from 78.9% in 2000. This may reflect the fact that for some products (notably electronics, appliances and clothing) production increasingly moved offshore. Their global supply chain would then be confined within Asian countries, which ship the finished product directly to markets in the developed world.
Geographic origin of imports
The drop since 1999 in the use of imported inputs tracks the broad geographic origin of imports into Canada. Imports from the US peaked at 68.2% of all Canada’s imports in 1998. Since then, imports from the US have risen only 1.7% a year on average, while imports from the rest of the world have grown an average of 8.7% a year. As a result, the US share of our imports has fallen to 54.6%, while overseas imports have risen from 31.8% to 45.4% (led of course by China, which by itself accounted for half the increase).15
Figure 5

The US was the source for 62% of intermediate imports into Canada. The US dominance reflects the need for parts imported to feed domestic assembly lines to be close by, especially as manufacturers adopt just-in-time inventory systems. Very few could wait for the month-long voyage from China, or support the cost of air travel from Asia or Europe.
The slight drop in the US share from 70% of intermediate imports in 1999 was concentrated in a few industries, notably autos, computer and electronics, clothing and mining. These reflect specific factors, including the increase in output by Asian-owned auto firms, the severe drop in Canada’s output of clothing and ICT goods (some of which also were sent offshore) and the increased importing of metal ores from Latin America for processing in Canada.
Interestingly, intermediate inputs account for two-thirds of all inputs from the US, versus less than 60% from the rest of the world. Excluding crude oil, the latter would be only about 50%.
Moreover, China’s exports consist largely of finished goods, not parts of intermediate inputs. In fact, until recently China itself was a model of a trading nation that imports many parts, assembles them and then exports the resulting products directly for purchase by consumers and businesses in North America and other markets.16 The shift in Canada’s imports from the US to Asia is consistent with a lower reliance on imported parts, and a higher rate of imports of finished goods.
Conclusion
This paper has examined the recent trend in the use of imported inputs by industries in Canada. It found that the sharp increase in imported inputs in the early 1990s began to slow later in the 1990s, hitting a peak in 1999. Since then, industries in Canada reduced their use of imported inputs until 2004. While the abrupt shrinkage of the ICT sector after 2000 and the downsizing of the auto sector led this decline, the drop in the use of imported inputs was pervasive. There was some evidence that firms were again beginning to increase their use of imported inputs after the loonie began rising in 2003, especially in the manufacturing sector.
The lower use of imported inputs sheds light on several widely discussed trends. It contradicts fears of a widespread offshoring of domestic production as firms adopt global supply chains. It suggests that firms in Canada have ample room to import more inputs as the soaring loonie increased competitive pressures, something they began to do in 2004. Finally, removing the import content from exports reveals Canada’s true exposure to export demand, an important piece of knowledge as analysts debate whether other countries can ‘decouple’ from the current slowdown in the US economy. Already since 2000, changes in exports had less of an influence on the course of GDP.
Recent feature articles
Notes
| * |
Industry Accounts Division 613-951-4108. |
| 1 |
P. Cross and G. Cameron, “The importance of exports to GDP and jobs.” CEO, Nov 1999. |
| 2 |
P. Cross and Z. Ghanem, “Cyclical implications of the rising import content in exports.” CEO, Dec 2002. |
| 3 |
In a related study, we found that firms are also buying more inputs from other companies in Canada as well as from abroad. P. Cross and Z. Ghanem, “Multipliers and outsourcing: how industries interact with each other and affect GDP.” CEO, Jan 2006. |
| 4 |
J. Helliwell, “Borders, Common Currencies, Trade, and Welfare: What Can We Learn from the Evidence.” Bank of Canada Review, Spring 2005. |
| 5 |
Alan Greenspan, The Age of Turbulence. The Penguin Press, NY 2007, p. 364. |
| 6 |
One estimate puts value-added exports at less than 10% of China’s GDP. See “An old Chinese myth,” The Economist, January 5, 2008. |
| 7 |
H. Kierzhowski and L. Chen, “Outsourcing and Trade Imbalances: The U.S.-China Case.” Paper presented at the DEGIT-XII conference in Melbourne, Australia, June 29-30, 2007, p. 4. |
| 8 |
Import prices rose 0.2% in 2002, then fell 6.8%, 2.6%, 1.1% and 1.0% the next four years and are on track to fall again in 2007. |
| 9 |
F. Roy, “Canada’s Changing Auto Industry.” CEO, May 2007. |
| 10 |
However, most of these industries were raising import use before 2002. Only for chemicals, electrical equipment and rubber and plastic did an increase in imports after 2002 reverse the downward trend before 2002. |
| 11 |
See C. Vorasarum, “How Does It End.” Forbes, Jan. 28, 2008. |
| 12 |
This calculation is based on a discussion by Jonathan Anderson, “Is China Export-Led?” UBS Investment Research, Sept. 27, 2007. Data for 2007 are for the first three quarters. |
| 13 |
P. Cross, “Recent trends in output and employment.” CEO, March 2007. |
| 14 |
Imports in this calculation exclude re-exports and personal spending abroad. |
| 15 |
These data are on a customs basis: on a balance of payments basis, the US share fell from 77% to 65%. |
| 16 |
Although recently, China has lowered its dependence on imported parts. See Li Cui, “China’s Growing External Dependence.” IMF Finance and Development Magazine, Sept. 2007, Vol. 44, no. 3. |
|