Feature article
2. Provincial growth in 2002
by J. Wilkinson*
Economic activity picked up markedly across Canada last year as
real gross domestic product growth accelerated in eight of the
13 provinces and territories.
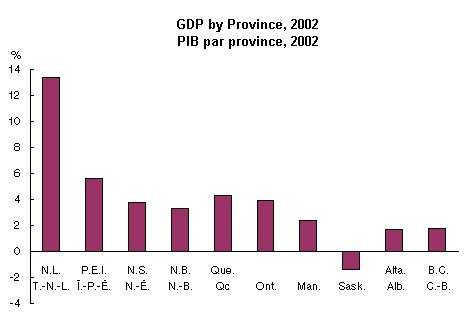
Newfoundland and Labrador led the pack in 2002, its real GDP rising a torrid
13.4%. This was more than twice the rate of growth in second-place Prince Edward
Island, where economic activity increased 5.6%. GDP in the remainder of the provinces
east of Manitoba, with the exception of New Brunswick, grew at rates exceeding
the national average of 3.4%. The western provinces, the territories and New
Brunswick grew at a below-average pace. Saskatchewan’s economy, hit by
drought and weak export markets, was the only one to contract.
Figure 1
Housing boomed across the country. Growth in housing starts exceeded 50% in
Quebec, and was more than 20% in seven other provinces. Continuing low interest
rates, growth in personal income and a strong job market all contributed
to the gains. Accelerating growth in furniture purchases was widespread as
many new homeowners shopped to furnish their homes. Financial services enjoyed
strong growth in every province, supported by consumer demand for loans.
Overall, consumer spending accelerated in 9 of the 13 provinces and territories.
Auto purchases contributed strongly, with growth ranging from a high of 14.7%
in Manitoba to a low of 6.2% in Newfoundland and Labrador, as manufacturers
offered financing incentives throughout the year.
Manufacturing production increased 2.5%, rebounding from a 4.7%
decline in 2001. Factories in Ontario accounted for almost 40%
of the gain, which was led by motor vehicles and parts. Shipbuilding
production tripled in Nova Scotia. In Quebec, wood product manufacturing,
including paper, jumped 15%. A bright spot for Saskatchewan was
a 25% surge in paper manufacturing, while a 7.7% gain in lumber
boosted British Columbia.
International exports recovered slightly from a decline in 2001,
but remained below levels reached in 2000. Provincially, results
were mixed. In Ontario, transportation equipment exports increased
more than 5%. Mineral fuel exports skyrocketed in Newfoundland
and Labrador. However, exports fell in Quebec as aircraft and other
transportation equipment dropped 11%. Several provinces were affected
by the continued weakness in the Information and Communication
Technologies (ICT) sector where production plunged another 17%.
In the west, grain exports plummeted in Saskatchewan and Alberta
on the heels of the drought. Growth in interprovincial exports
exceeded international exports for the second year in a row.
In all provinces except the prairies, businesses built-up in inventories in
2002 following a reduction in stocks in 2001. This was concentrated in Ontario,
where the retail auto stocks were replenished following a drawdown in 2001.
Farmers reduced inventories, particularly in Saskatchewan and Alberta, to
meet demand under drought conditions.
Growth in labour income ranged from a high of 15% in the Northwest
Territories, where diamond mining boosted incomes, to a low of
2% in British Columbia. Nationally, strong employment growth and
a reduction in average hours worked resulted in 1.5% more hours
worked. A portion of the decrease in average hours worked was due
to part-time jobs, which accounted for about 40% of the employment
increase in 2002.
Profits rebounded 6% in 2002 following a 9% drop in 2001. Again,
results were mixed among the provinces, with Ontario and Quebec
showing strong growth as a result of manufacturing. In Alberta,
profits tumbled more than 20% in the wake of declining natural
gas prices.
The Atlantic Region
Economic growth in Newfoundland and Labrador soared 13.4% in 2002,
double the rate of any year in the past two decades. It was also
the strongest growth among the provinces, and it has exceeded
the national rate in four of the last five years.
Oil from offshore fields propelled the gain, with the Terra Nova oil field
coming on stream early in the year. Total exports grew more than 27%, as
exports of crude oil rose 63%. Further increases in output are expected in
2003 with the development of the White Rose field. Corporate profits surged
more than 80%, boosted by both price and volume increases in the oil industry.
Spending on oil and gas extraction equipment helped boost business investment
in machinery and equipment more than 17% following a decline in 2001. In
addition, government investment in machinery and equipment more than doubled, mainly due to the purchase of helicopters.
Growth in personal spending slowed to 1.8%, its lowest in six years. Residential
construction jumped more than 20%, as housing starts surged to their strongest
growth in 30 years. Employment increased at about half the national rate and
the unemployment rate increased to 17%, the highest in four years.
Output in Prince Edward Island grew 5.6%, following a flat 2001.
Agricultural production was the largest contributor to this growth,
up 21%. Potato farmers enjoyed better conditions following several
years of drought, crop disease and US trade barriers. Exports of
potatoes jumped and agricultural inventories were built up. Food
manufacturing increased 7%, its 7th consecutive increase.
Machinery and equipment expenditures surged 23%, with many industries recording
increases, the largest in retail trade. Corporate profits rebounded following
a drop in 2001.
Residential construction increased 16%, nearly matching gains in 1999 and 2000.
Output of financial services advanced 5.5%, stimulated by increased demand
for mortgage financing and insurance. Bolstered by a 4.9% growth in labour
income, consumer spending rose 2.4%, accelerating from 2001. However, this
increase in spending fell short of the growth during the five years previous
to 2001.
Economic activity in Nova Scotia increased 3.8% in 2002, well ahead of 2001
when growth was 2.5%. Growth has averaged 2.4% over the past decade.
Production in the shipbuilding industry tripled in 2002, as upgrades
to a drilling platform, imported in 2001, were undertaken. Tire
production jumped in response to higher North American auto production.
Fish products were also an important contributor to an overall
5.3% increase in exports. Natural gas output from Sable Island
levelled off following two years of increasing production. Restrained
by lower natural gas prices, corporation profits grew a modest
1.4%.
Investment in residential construction jumped 13%, as housing starts grew 21%.
New car sales jumped almost 10% and furniture sales followed close behind.
Non-residential construction declined for the third consecutive year. Federal
government purchases of helicopters lifted government machinery and equipment,
which more than doubled.
New Brunswick’s economy grew 3.3% in 2002, the strongest gain in three
years. Rising demand for refined petroleum products boosted exports. Increased
crude oil imports from the new Terra Nova field fuelled this industry.
Despite the introduction of the US softwood lumber tariffs, lumber
exports from New Brunswick increased in line with sawmill production
which was up 12%. In addition, pulp and fish exports jumped. Telecommunication
carriers continued an 8 year string of strong growth thanks to
increased demand for long distance services from call centres.
Residential construction increased more than 13%. Consumer spending rose 2.1%
with widespread increases for goods, while spending on services slowed. Contributing
to the growth was a 9% increase in car sales, as well as clothing.
Central Canada
Quebec’s economy grew 4.3% in 2002, a significant pick-up
from the 1.1% growth registered in 2001. Spectacular growth in
house construction was a major contributor. Housing starts exploded
more than 50%, outstripping growth in any other province. Investment
in residential structures increased 26%, the largest increase since
1983. A 7% increase in retail trade was driven by new car sales,
while furniture sales responded to a strong housing market.
International exports fell 2.4%, their second straight decline.
Aircraft and telephone equipment exports fell at a double digit
rate. Production of computer and electronic products was down 21
%. Growth in paper and aluminum exports offset some of these losses.
Government investment in structures, stimulated by the provinces’ infrastructure
program, jumped 31%, marking the largest increase in two decades. Local governments
also recorded more capital spending.
Quebec’s economy generated an increase of 2.4% in hours worked, contributing
more than one-third of the total increase for the entire country. Unemployment
fell to 8.6%, while labour income grew 5.3%
Economic activity in Ontario moved ahead 3.9% in 2002, equalling
the average growth of the past decade. Higher auto production was
a major contributor. Auto-related manufacturers and consumer spending
also posted strong growth. Job growth and low interest rates spurred
household spending, up 3.1%. Investment in residential structures
increased a robust 11.7%, the highest since 1999.
Ontario’s exports underwent a partial recovery after declining in 2001.
The auto-driven recovery also led to a 10% increase in manufacturing of auto
parts and a 5.8% growth in fabricated metal products. However, high-tech products,
such as computers and telephone apparatus, continued to languish.
Labour income in Ontario grew 4.4% in 2002. While hours worked
bounced back from 2001, they increased less than the national average
for the first time in five years.
Western Canada
Real GDP in Manitoba increased 2.4% in 2002, improving on the 1.4%
gain the year before. New homebuilding and stronger personal spending
contributed to this increase. Crop conditions also were much better
than in other Prairie provinces.
Registering significant gains were residential construction, retail trade,
and finance industries, as consumers responded to low interest rates and
stronger employment. Personal spending advanced 2.4%, as auto sales jumped
15%, the second double-digit increase in a row. Housing starts leapt 22%,
the largest increase since 1994.
Manufacturing advanced 1.4%, rebounding from a decline the year before. Food,
furniture and farm equipment contributed to this growth. Exports climbed
1.3% largely on the strength of farm equipment sales.
Business investment advanced 3.5% as soaring residential construction more
than offset slower growth in plant and equipment. Corporate profits rebounded
from a slump in 2001.
Output in Saskatchewan fell 1.4%, the second straight annual
decline. This was the province’s only back-to-back decrease
in two decades. Drought resulted in a drop in agricultural production
of 29%. Production from the crude oil industry declined 5.8%.
Farm production was hit hard by ongoing drought conditions, insect
infestations and late rains. As a result, exports fell 4.7%, as
both wheat and canola plunged by almost 30%. While agriculture
and mining suffered declines, increases were recorded in manufacturing,
telecommunications and retail trade.
Government and business investment fell, as construction wound
up on a major electrical generation plant. A bright note in construction
was the strong housing market, where housing starts jumped by almost
one-quarter and residential construction investment was up 14%.
Corporate profits recovered about half their loss in 2001 with
a robust 10% increase.
Growth slowed to 1.7% in Alberta in 2002, well below the national
rate of 3.4%. Lower energy prices and severe drought for the second
year in a row hurt key industries. Consumer spending remained strong
and housing increased.
A strong 23% gain in residential construction was offset by less investment
in non-residential structures. Investment in the mining, oil and gas industries
fell sharply, as fewer wells were drilled in 2002 than in 2001. Companies
scaled back production in the oil patch because of reduced demand south of
the border, the second consecutive decline. Both natural gas exports and
crude oil exports fell.
Beef exports were up sharply, as farmers sold off some of their
stock because of difficulties finding feed under drought conditions.
Farm production plunged 28%, with farmers experiencing a third
consecutive decline in income.
Despite slower growth for the second consecutive year, labour
market conditions remained healthy. In 2002, jobs increased by
3.1% on top of 3.6% a year earlier, and labour income rose 7.2%.
British Columbia’s economy grew 1.8% in 2002, well below
the national average. Growth in housing and services such as wholesale,
retail and finance led the way, while resource-based industries
faltered.
Exports registered a 0.8% increase after a 4.3% decline in 2001.
Increased homebuilding boosted sawmill production 7.6%. Lumber
manufacturers increased output early in the year when US tariffs
fell, then responded to higher tariffs by lowering production costs
and boosting output. Mining output, including mineral fuels, fell
7%. Coal, natural gas and metal ore exports declined. Corporate
profits fell for the second consecutive year.
Residential construction increased 16%, partly offset by a 21%
drop in business non-residential investment and falling machinery
and equipment expenditures. Construction of health and education
facilities led government capital spending. Low interest rates
also boosted personal expenditures, with strong sales of durable
goods.
Note
Income and Expenditure Accounts Division (613) 951-3640. Adapted from the Daily, April 28.
|


