Feature article
Social Assistance Use: Trends in incidence, entry and exit rates
by R. Sceviour and R. Finnie*
Introduction
Social Assistance (SA) participation rose sharply during the recession
of the early 1990s. Subsequently, the economy strengthened, especially
after 1995, while virtually all provinces instituted changes
aimed at reducing welfare dependency. Eligibility rules were
tightened (especially for new entrants), benefit levels were
cut, “snitch” lines were introduced, and other rule
and procedural changes were adopted. Following these developments,
the number of SA-dependent individuals fell sharply from a peak
of 3.1 million to under 2 million by the year 2000, and
the benefit pay-out fell from $14.3 billion in 1994 to $10.4 billion
in 2001.
This paper explores the dynamics of Social Assistance use over
this period to calculate annual incidence and entry and exit rates
at both the national and provincial level, broken down by family
type. These breakdowns, available for the first time ever, are
revealing as policy varied by province and family type and not
all provinces shared equally in the recession or the expansion
that followed it.
The paper does not attempt to apportion the movements in SA participation
rates between those related to the economy and changes in the administration
of welfare. The focus is on the empirical record of SA entry, exit,
and annual participation rates.
Broadly speaking:
- Incidence and entry generally followed the business cycle at
the national level, while exits were relatively steady. Most
of the overall drop in welfare cases reflected fewer people entering
the system, which fell by over a half in the 1990s.
- While incidence and entry rates declined steadily over most
of the period for all family types, the precise pattern and
overall decline varied considerably by family type.
- Exit patterns were more variable and exhibited pronounced differences
across family types, with the presence of children appearing
to play a decisive role.
- Important differences exist in these trends and patterns by
province.
Figure 1

An individual is defined as receiving SA in any particular year
if they or their spouse declare SA income of at least $101. The
family basis is used because typically SA is awarded for the entire
family. The analysis includes only individuals aged
18 to 64. The lower cut-off eliminates students and others who
either are not eligible for SA (rules vary by province), or for
whom SA status has a different significance than for others. Individuals
over 64 are not generally eligible for SA. The disabled are also
excluded: while they represent an important group of SA recipients,
we leave them for a separate study.
The definition of entry into SA is straightforward: for any two consecutive
years, entry is deemed to have occurred in the second year if the individual
is not on SA in the first year, but is in the second. The exit definition
is slightly more complicated: in any two consecutive years, an exit is defined
to have occurred in the first if the person was on SA then, but not the next.
This is because the data imply that at some point in the first year the person
went off SA. That is, they report SA income for the first year, but the absence
of any SA income in the second year indicates they were no longer on SA at
the end of the first year. In addition, we need to observe the individual
in the year before any pair of years that define whether an exit has occurred
in order to have their province and family status (the dimensions along which
our analysis is broken down) at the beginning of this interval.
Analyses of SA are more frequently based on monthly data, which is how SA is
administered (individuals qualify on a month-to-month basis), but here we
examine participation, entry, and exit on an annual basis. This approach
is driven by the tax-based nature of the data.
The principal disadvantage of the annual approach is that it misses cases where
an individual moves on and off SA over the course of a year, simply recording
that the individual was on SA at some point. While missing such intra-year
dynamics might be considered a limitation, an annual perspective may provide
a more robust, longer-term measure of SA participation precisely because it
ignores short-run movements. The shorter movements could be considered part
of what is truly a single longer spell of SA participation with some spurious
monthly variations in status.
The setting
The 1990s were characterized by several developments with potentially
important implications for SA participation. The decade started
with a lingering recession and slow recovery, followed by strong
growth after 1995, with the unemployment rate by 2000 five percentage
points below its peak. This improvement in the job market provided
many individuals an opportunity to escape from – or avoid – welfare
dependency.
Provinces generally reduced SA benefits and instituted rule and procedural
changes that made benefits more difficult and more onerous to obtain. Federal
funding for SA was combined into a lump sum that also covered health and post-secondary
education, and overall payments were cut. The Child Tax Benefit and its associated
low-income supplement were introduced, partly with the objective of taking
children off welfare. And EI eligibility was tightened and benefit levels reduced.
Another important development was that the real value of SA benefits
fell, often by large amounts. By 2000, payments typically reached
only 30% of Statistics Canada’s low-income cut-off (LICO)
income levels, rather than the 40% average in 1985. Such declines
in the value of SA payments provided an incentive for individuals
to seek alternative income sources.
Provinces also changed the rules governing the receipt of SA and the related
administrative procedures – such as the employment of additional monitors,
the opening of ‘snitch lines’, the introduction of requirements
that recipients collect their cheques in person, and so on. Again, these changes
would be expected to reduce SA participation rates.
Two other developments had implications for SA participation.
The Child Tax Benefit (CTB) was introduced in 1992, and a supplement
was put into place in 1998 for low-income families with children.
The provinces agreed to reduce SA payments to households with children
by an amount equal to the supplement. These savings were to be
invested in other programs benefiting children and families with
children, but the CTB is subject to a more gradual ‘claw-back’ when
an SA recipient joins the work force, presumably helping individuals
escape dependence on welfare. As well, the rules governing Employment
Insurance (EI) benefits were tightened. The effect of tighter EI
regulations on the number of SA recipients is unclear: individuals
may have substituted SA for EI as the latter became less available
and less generous. Alternatively, more stringent EI regulations
may induce individuals to stay at their jobs longer (or search
harder for an alternative job if faced with unemployment) rather
than enter into an EI-SA cycle.
At a broader level, this period also saw a major transformation in funding
for this provincially operated program. The federal government cut transfers
in 1995 and altered the method of transferring funds, by introducing a lump-sum
transfer to cover SA, health, and post-secondary education. Once a shared-cost
program, SA expenditures were now the full responsibility of provincial governments.
These changes in the method of transferring funds to the provinces
were mirrored by similar developments in the US. It also switched
from a federal-state shared-cost system to a lump-sum transfer,
which was accompanied by fundamental changes to welfare, including
a 5-year lifetime limit on the receipt of welfare, regulations
on the time frame for returning to work after childbirth, ‘workfare’ requirements
for individuals who could not find employment, and penalties for
those who do not abide by the rules. In addition, many states experimented
with ‘waivers’ that allowed them to implement greater
incentives for individuals to return to work.
The consequences of this legislation and a growing economy are
clear: the caseload in the US fell to less than half of its 1994
peak. This reduction also reflected an enhancement of the earned
income tax credit, higher minimum wages, and an expansion of benefits
and support to individuals moving from welfare dependence to work.
National trends
Singles, couples with children, and couples without children all
experienced peaks in SA use in 1993, while lone mothers peaked
in 1995. Thereafter, all groups experienced significant and steady
declines. By 2000 all groups had lower dependency rates than
at the beginning of the decade (except single individuals).
Single mothers had the most dramatic change. By 2000, their rate of SA use
was 33.6%, one-third below its peak of 50.1%. Unattached individuals had
the next largest drop, easing from 21% to 16%. Couples without children had
the lowest rates, falling from 7% to 4%; couples with children had moderately
higher rates (10% to 5%).
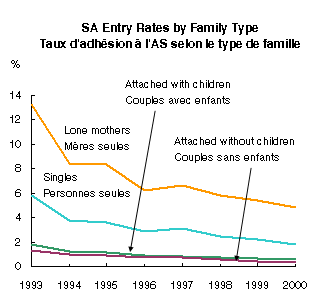
Figure 2

Declining entry rates clearly played a significant role in the fall in SA use
(Figure 3). The overriding pattern that emerges is a strong decline in entry
rates among all family types. Lone mothers are again notable. While they have
the highest entry rate in every year, they also exhibit the largest absolute
decline: 13.3% of all lone mothers not on SA in 1992 entered into it in 1993,
but the entry rate decreased by two-thirds to 4.8% by 2000.
Figure 3
Couples had lower entry rates in every year than lone-mothers and singles, and
more moderate declines over time. The declines are, however, still large in
relative terms. For example, entry rates for couples with children declined
from 1.7% in 1992 to 0.6% in 2000. Couples without children had similar levels
and trends. Singles again lie between lone mothers and couples, with their
entry rate declining from about 6% to just under 2%.
Trends in exit rates have been less uniform. They would normally be expected
to rise as the economy improves, but with the rapidly declining entry rates
just noted, the stock of SA participants likely changed. Depending on these
composition effects, exit rates may either increase or decrease. Figure 4
shows the trends.
Figure 4

Lone mothers saw a sizeable increase in exit rates. In 1992, they were at the
bottom among family types, with only 12.4% a year exiting SA. By 2000, they
were in the middle with 21.4%. Singles experienced steady decreases and had
the lowest exit rate at the end of the period. Couples with children had the
highest exit rates in almost all years, and these increased over time. Couples
without children started with the highest exit rates, but by 2000 were the
same as lone mothers.
Overall, exit rates by family type have shown considerable variability and
different trends than entry rates. The large drop in annual SA participation
rates appears to be explicable largely in terms of dramatically declining
entry rates for all family types. Higher exit rates for lone mothers and
couples with children were offset by decreases in exit rates for singles
and couples without children.
Provincial trends
The national analysis helps frame how different provincial policy
measures and economic trends may have affected welfare experiences
across the country. For example, Ontario and Alberta were among
those that led the way in making SA less attractive to potential
claimants. In addition, economic growth was not uniform across
all provinces, and this too would be expected to affect SA dynamics.
Incidence
Table 1 shows annual SA participation rates for single individuals
by province. Every province experienced a jump in SA rates between
1992 and 1993 (reflected in the national trend previously seen),
yet the data show some important differences. Alberta had the lowest
rate in practically all years, falling to 9.2% by 2000 (PEI was
second at 12.0%). Quebec and Newfoundland were the opposite, as
their rates rose sharply in 1993 and then remained high through
2000, to finish well above the other provinces at 21.0 and 21.4%, respectively.
Table 1: Social assistance rates
| |
1992 |
1993 |
1994 |
1995 |
1996 |
1997 |
1998 |
1999 |
2000 |
| Singles |
|
|
|
|
|
|
|
|
|
| Canada |
15.0 |
20.5 |
20.3 |
20.1 |
19.3 |
18.7 |
17.8 |
16.9 |
15.9 |
| Newfoundland and Labrador |
11.5 |
18.5 |
19.5 |
22.3 |
21.9 |
22.7 |
22.2 |
21.6 |
21.0 |
| Prince Edward Island |
11.5 |
15.9 |
15.7 |
13.8 |
13.5 |
14.0 |
14.4 |
12.7 |
12.0 |
| Nova Scotia |
10.5 |
16.1 |
16.2 |
16.9 |
16.5 |
16.7 |
14.6 |
15.8 |
12.7 |
| New Brunswick |
15.1 |
21.4 |
19.5 |
20.1 |
19.1 |
19.3 |
18.8 |
18.3 |
17.5 |
| Quebec |
16.8 |
23.4 |
23.9 |
24.2 |
24.3 |
24.2 |
23.6 |
22.3 |
21.4 |
| Ontario |
16.4 |
21.1 |
20.9 |
20.1 |
18.9 |
18.0 |
16.8 |
15.5 |
14.1 |
| Manitoba |
14.3 |
17.3 |
16.0 |
17.2 |
14.8 |
14.6 |
13.8 |
12.6 |
12.2 |
| Saskatchewan |
9.9 |
16.2 |
17.4 |
16.5 |
16.2 |
14.9 |
15.1 |
14.4 |
15.4 |
| Alberta |
10.4 |
12.6 |
10.4 |
10.8 |
10.6 |
9.5 |
9.6 |
9.4 |
9.2 |
| British Columbia |
13.3 |
20.6 |
20.8 |
19.3 |
17.4 |
16.8 |
15.8 |
15.5 |
15.4 |
| |
|
|
|
|
|
|
|
|
|
| Attached with Children |
|
|
|
|
|
|
|
|
|
| Canada |
7.8 |
9.2 |
9.4 |
8.9 |
8.4 |
7.8 |
7.0 |
6.3 |
5.9 |
| Newfoundland and Labrador |
8.3 |
11.2 |
11.3 |
13.2 |
13.3 |
12.9 |
12.4 |
11.4 |
10.8 |
| Prince Edward Island |
7.0 |
8.0 |
7.5 |
7.7 |
6.6 |
7.1 |
6.0 |
5.4 |
4.6 |
| Nova Scotia |
6.2 |
8.2 |
8.0 |
8.0 |
7.9 |
7.5 |
6.3 |
7.1 |
5.8 |
| New Brunswick |
7.7 |
8.9 |
8.1 |
7.8 |
8.5 |
8.4 |
7.9 |
7.2 |
7.1 |
| Quebec |
6.9 |
8.6 |
9.1 |
8.8 |
9.2 |
9.0 |
8.0 |
7.3 |
7.1 |
| Ontario |
9.1 |
10.6 |
11.1 |
10.3 |
9.1 |
8.3 |
7.5 |
6.3 |
5.6 |
| Manitoba |
6.1 |
7.3 |
6.9 |
7.0 |
6.5 |
6.0 |
5.5 |
5.2 |
5.1 |
| Saskatchewan |
6.4 |
7.9 |
8.4 |
7.4 |
7.4 |
7.0 |
7.4 |
7.2 |
7.8 |
| Alberta |
7.6 |
7.6 |
5.3 |
5.2 |
4.8 |
3.7 |
3.9 |
3.7 |
3.6 |
| British Columbia |
7.1 |
9.0 |
9.3 |
8.7 |
7.9 |
7.0 |
5.9 |
5.5 |
5.5 |
| |
|
|
|
|
|
|
|
|
|
| Attached without Children |
|
|
|
|
|
|
|
|
|
| Canada |
4.6 |
6.1 |
6.0 |
5.5 |
5.1 |
4.8 |
4.3 |
4.0 |
4.0 |
| Newfoundland and Labrador |
4.4 |
6.1 |
6.0 |
6.6 |
6.8 |
7.0 |
6.7 |
6.6 |
6.2 |
| Prince Edward Island |
3.1 |
4.2 |
3.9 |
2.4 |
2.9 |
2.9 |
2.6 |
2.5 |
2.0 |
| Nova Scotia |
3.3 |
5.0 |
4.6 |
4.5 |
4.5 |
4.0 |
3.3 |
3.7 |
3.4 |
| New Brunswick |
4.5 |
6.1 |
5.8 |
5.4 |
5.2 |
5.2 |
5.2 |
4.5 |
4.6 |
| Quebec |
5.3 |
7.0 |
7.3 |
6.9 |
6.9 |
6.7 |
6.2 |
5.6 |
5.7 |
| Ontario |
5.2 |
6.8 |
6.7 |
5.8 |
5.0 |
4.7 |
4.2 |
3.7 |
3.7 |
| Manitoba |
3.0 |
3.7 |
3.3 |
3.3 |
2.8 |
2.5 |
2.0 |
2.2 |
2.1 |
| Saskatchewan |
2.4 |
3.6 |
3.5 |
3.2 |
2.8 |
2.7 |
2.5 |
2.5 |
2.6 |
| Alberta |
3.7 |
4.0 |
2.9 |
3.0 |
2.8 |
2.3 |
2.4 |
2.4 |
2.6 |
| British Columbia |
4.0 |
5.7 |
5.6 |
4.9 |
4.4 |
4.0 |
3.3 |
3.2 |
3.2 |
| |
|
|
|
|
|
|
|
|
|
| Lone Mothers |
|
|
|
|
|
|
|
|
|
| Canada |
46.9 |
48.0 |
48.6 |
50.1 |
47.6 |
45.4 |
41.6 |
36.3 |
33.6 |
| Newfoundland and Labrador |
46.4 |
50.9 |
51.4 |
55.7 |
53.6 |
55.3 |
53.7 |
49.2 |
49.7 |
| Prince Edward Island |
50.0 |
53.8 |
51.0 |
45.5 |
46.2 |
44.2 |
43.8 |
36.6 |
36.0 |
| Nova Scotia |
52.5 |
56.1 |
56.3 |
56.4 |
53.6 |
53.1 |
45.0 |
50.1 |
41.5 |
| New Brunswick |
52.9 |
51.7 |
46.8 |
47.6 |
47.6 |
48.3 |
45.1 |
40.7 |
38.8 |
| Quebec |
37.7 |
41.9 |
43.9 |
45.7 |
44.8 |
43.9 |
39.7 |
35.2 |
32.0 |
| Ontario |
53.4 |
52.9 |
54.9 |
56.1 |
52.3 |
49.7 |
45.2 |
37.5 |
33.2 |
| Manitoba |
42.7 |
42.4 |
42.2 |
43.5 |
41.4 |
39.0 |
37.7 |
34.1 |
33.7 |
| Saskatchewan |
45.7 |
47.7 |
47.7 |
48.4 |
46.7 |
45.4 |
44.6 |
45.7 |
44.4 |
| Alberta |
45.5 |
40.2 |
34.7 |
34.1 |
31.9 |
27.0 |
25.3 |
22.6 |
22.2 |
| British Columbia |
46.9 |
48.5 |
49.3 |
52.7 |
49.2 |
46.2 |
41.3 |
37.8 |
37.1 |
Ontario changed from having one of the highest SA rates in the
earlier years to having one of the lowest. The Prairie and Maritime
provinces were generally concentrated close to the mean in terms
of both levels and trends.
The patterns for couples with children are broadly similar to those for singles.
However, some provinces – Ontario and Alberta in particular – have
had greater relative declines than others. Newfoundland is again an exception,
while Quebec is more like the other provinces for this family type.
For couples without children, Alberta no longer stands out as
having a uniquely lower rate, with rates similar to Saskatchewan,
PEI and Manitoba. Newfoundland and Quebec maintained the higher
rates that emerged in 1993, and Ontario had the largest decreases.
For the lone-mother category, both the initial peaks and subsequent declines
were more dispersed. Alberta and Ontario again experienced steep drops, though
from different peaks. Newfoundland maintained the highest rates over time.
Quebec is notable in having attained one of the lowest rates by the end of
the decade. The trend in the remaining provinces is characterized by an inverted
U-shaped dependency rate to varying degrees.
Entry
Entry rates into SA at the national level showed large decreases for all family
types, especially lone-mothers. All provinces experienced substantial decreases
in entry rates for singles. Newfoundland had the highest rates and Alberta
generally the lowest in most years. Ontario again shows the sharpest decline,
from 6.2% in 1992 to 1.5%, the same rate as Alberta, Manitoba and BC.
For couples with children, Newfoundland again had the highest rates, but also
the largest decline with a drop of two-thirds between 1992 and 2000. Most
other provinces show relatively weaker downward trends over time, with the
exception (again) of Ontario, which by 2000 attained the lowest entry rate.
Saskatchewan’s experience is also noteworthy for moving from being
in the middle rank towards having higher than average entry rates.
Couples without children display a broad and fairly uniform pattern of decline.
Newfoundland again has the highest rates throughout, although they still
declined over time; Ontario had largest drop, while Quebec and BC showed
significant declines as well.
Table 2: Entry rates
| |
1993 |
1994 |
1995 |
1996 |
1997 |
1998 |
1999 |
2000 |
| Singles |
|
|
|
|
|
|
|
|
| Canada |
5.8 |
3.8 |
3.6 |
2.9 |
3.1 |
2.5 |
2.2 |
1.8 |
| Newfoundland and Labrador |
8.0 |
5.4 |
6.1 |
3.8 |
4.7 |
3.6 |
3.5 |
3.9 |
| Prince Edward Island |
5.1 |
3.6 |
2.6 |
2.7 |
3.7 |
2.3 |
2.1 |
1.3 |
| Nova Scotia |
4.5 |
3.7 |
3.6 |
3.0 |
3.4 |
2.7 |
2.0 |
2.0 |
| New Brunswick |
6.1 |
3.8 |
4.8 |
3.2 |
3.9 |
3.1 |
3.1 |
2.7 |
| Quebec |
6.2 |
3.9 |
3.8 |
3.5 |
4.0 |
3.1 |
2.8 |
2.4 |
| Ontario |
6.2 |
4.1 |
3.6 |
2.7 |
2.9 |
2.2 |
1.9 |
1.4 |
| Manitoba |
4.7 |
2.7 |
3.2 |
2.1 |
2.6 |
1.9 |
1.7 |
1.5 |
| Saskatchewan |
4.4 |
3.4 |
2.8 |
2.2 |
2.7 |
2.5 |
2.3 |
1.9 |
| Alberta |
3.6 |
2.2 |
2.9 |
1.9 |
1.6 |
1.9 |
1.7 |
1.4 |
| British Columbia |
5.9 |
4.0 |
3.5 |
2.9 |
3.0 |
2.4 |
2.3 |
1.7 |
| |
|
|
|
|
|
|
|
|
| Attached with Children |
|
|
|
|
|
|
|
|
| Canada |
1.8 |
1.2 |
1.1 |
0.9 |
0.9 |
0.8 |
0.7 |
0.6 |
| Newfoundland and Labrador |
4.1 |
2.3 |
3.3 |
2.3 |
2.0 |
2.1 |
1.8 |
1.6 |
| Prince Edward Island |
1.4 |
1.7 |
1.0 |
1.5 |
1.5 |
0.7 |
0.7 |
0.7 |
| Nova Scotia |
2.0 |
1.4 |
1.5 |
1.3 |
1.1 |
1.0 |
0.6 |
0.7 |
| New Brunswick |
2.0 |
1.0 |
1.3 |
1.6 |
1.6 |
1.2 |
0.8 |
1.0 |
| Quebec |
1.7 |
1.2 |
1.2 |
1.0 |
1.0 |
0.7 |
0.7 |
0.6 |
| Ontario |
2.0 |
1.4 |
1.0 |
0.8 |
0.7 |
0.6 |
0.5 |
0.4 |
| Manitoba |
1.4 |
0.7 |
0.8 |
0.7 |
0.7 |
0.6 |
0.7 |
0.7 |
| Saskatchewan |
1.5 |
1.1 |
0.9 |
1.1 |
1.0 |
1.4 |
1.3 |
1.2 |
| Alberta |
1.1 |
0.7 |
1.0 |
0.8 |
0.5 |
0.9 |
0.7 |
0.5 |
| British Columbia |
1.7 |
1.3 |
1.2 |
1.0 |
1.0 |
0.8 |
0.9 |
0.6 |
| |
|
|
|
|
|
|
|
|
| Attached without Children |
|
|
|
|
|
|
|
|
| Canada |
1.3 |
1.0 |
0.9 |
0.7 |
0.7 |
0.6 |
0.5 |
0.3 |
| Newfoundland and Labrador |
1.8 |
1.5 |
2.1 |
1.4 |
1.5 |
1.3 |
1.2 |
0.9 |
| Prince Edward Island |
1.4 |
0.4 |
0.8 |
0.0 |
0.7 |
0.7 |
0.7 |
0.3 |
| Nova Scotia |
1.3 |
0.9 |
0.8 |
0.8 |
0.7 |
0.5 |
0.5 |
0.4 |
| New Brunswick |
1.3 |
1.0 |
1.1 |
1.0 |
1.0 |
0.9 |
0.6 |
0.7 |
| Quebec |
1.5 |
1.2 |
1.1 |
1.0 |
0.9 |
0.7 |
0.6 |
0.4 |
| Ontario |
1.5 |
1.1 |
0.9 |
0.7 |
0.7 |
0.5 |
0.3 |
0.3 |
| Manitoba |
0.9 |
0.4 |
0.6 |
0.3 |
0.3 |
0.2 |
0.3 |
0.2 |
| Saskatchewan |
0.8 |
0.5 |
0.4 |
0.3 |
0.4 |
0.3 |
0.3 |
0.3 |
| Alberta |
0.7 |
0.5 |
0.6 |
0.5 |
0.4 |
0.5 |
0.4 |
0.3 |
| British Columbia |
1.3 |
0.9 |
0.9 |
0.7 |
0.7 |
0.5 |
0.5 |
0.3 |
| |
|
|
|
|
|
|
|
|
| Lone Mothers |
|
|
|
|
|
|
|
|
| Canada |
13.3 |
8.5 |
8.4 |
6.3 |
6.7 |
5.8 |
5.4 |
4.8 |
| Newfoundland and Labrador |
18.8 |
10.8 |
14.1 |
7.0 |
10.4 |
9.4 |
4.7 |
8.0 |
| Prince Edward Island |
19.2 |
10.9 |
9.6 |
10.0 |
6.8 |
9.5 |
7.7 |
6.9 |
| Nova Scotia |
13.7 |
8.9 |
7.2 |
7.0 |
7.9 |
6.3 |
5.3 |
5.5 |
| New Brunswick |
13.4 |
8.3 |
11.4 |
8.6 |
9.4 |
6.9 |
5.6 |
5.4 |
| Quebec |
13.0 |
7.1 |
6.6 |
5.8 |
6.8 |
4.7 |
4.3 |
3.9 |
| Ontario |
14.2 |
9.1 |
7.8 |
5.5 |
5.9 |
4.7 |
4.8 |
3.9 |
| Manitoba |
10.3 |
7.5 |
7.4 |
5.2 |
5.2 |
5.6 |
5.5 |
5.6 |
| Saskatchewan |
13.9 |
10.4 |
11.1 |
8.2 |
9.2 |
12.7 |
11.3 |
11.0 |
| Alberta |
9.7 |
7.3 |
8.9 |
7.2 |
5.7 |
7.1 |
6.1 |
5.3 |
| British Columbia |
13.7 |
9.8 |
11.3 |
7.1 |
7.7 |
6.7 |
7.0 |
6.3 |
Lone mothers had a broad if erratic pattern of decline. Newfoundland is particularly
volatile, but it is also characterised by generally high rates throughout.
Ontario again experienced the sharpest decline in entry rates, with Quebec
not far behind. Saskatchewan is again an outlier in showing increases rather
than decreases, which in this case left it with the highest entry rates of
all.
In sum, the provincial experiences were broadly similar, with entry rates declining
for virtually all family types and provinces, even though the rates of decline
show some important differences.
Exits
A very different pattern emerges for exit rates, which rose for
lone mothers and for couples with children and fell for singles
and couples without children. This suggests some heterogeneity
on the exit side. In particular, as a result of the improving
economy and some provinces making it more difficult to obtain
SA, the population of individuals on welfare changed, with more
of the sort of recipient who would have greater difficulty leaving
welfare in any given year, thus driving exit rates down. At the
same time, the stronger economy and other changes would enable
people to leave SA more easily.
For singles, Quebec had the lowest exit rates in all years. Together
with their relatively high entry rates seen above, these yield
the highest annual incidences of SA participation of all provinces,
with relatively little fall-off during the latter half of the 1990s.
In short, the high rate of SA participation among singles in Quebec
is driven by both entry and exit dynamics. Newfoundland has a very
similar pattern: consistently low exit rates and high, though declining,
entry rates, giving high annual incidences with only a small decline
by 2000.
Ontario, in contrast, ranked in the middle of exit rates, with
moderate declines over time; combined with strong reductions in
entry rates, the overall result is a sharp reduction in incidence.
A similar picture describes the experiences of several other provinces,
although the changes are less dramatic than for Ontario.
Table 3: Exit rates
| |
1993 |
1994 |
1995 |
1996 |
1997 |
1998 |
1999 |
| Singles |
|
|
|
|
|
|
|
| Canada |
17.9 |
15.8 |
18.0 |
15.8 |
16.2 |
14.5 |
12.4 |
| Newfoundland and Labrador |
22.5 |
12.3 |
17.6 |
14.6 |
15.6 |
15.1 |
11.8 |
| Prince Edward Island |
25.0 |
25.6 |
22.0 |
15.0 |
22.5 |
14.0 |
15.9 |
| Nova Scotia |
17.3 |
16.1 |
18.1 |
18.0 |
17.6 |
16.0 |
21.5 |
| New Brunswick |
21.9 |
17.9 |
18.7 |
15.6 |
17.0 |
14.0 |
13.0 |
| Quebec |
11.8 |
11.0 |
14.6 |
12.5 |
13.1 |
11.8 |
9.9 |
| Ontario |
19.4 |
18.1 |
19.4 |
16.5 |
18.0 |
16.6 |
13.8 |
| Manitoba |
19.1 |
13.3 |
19.5 |
17.0 |
20.6 |
19.9 |
15.3 |
| Saskatchewan |
20.7 |
20.4 |
19.1 |
19.9 |
17.4 |
13.0 |
12.2 |
| Alberta |
34.8 |
20.7 |
21.7 |
23.7 |
17.0 |
16.7 |
15.0 |
| British Columbia |
23.0 |
21.4 |
22.6 |
20.2 |
19.7 |
16.2 |
13.7 |
| |
|
|
|
|
|
|
|
| Attached with Children |
|
|
|
|
|
|
|
| Canada |
26.5 |
26.6 |
27.5 |
27.3 |
28.6 |
30.5 |
29.8 |
| Newfoundland and Labrador |
25.8 |
16.9 |
20.4 |
21.3 |
24.6 |
24.5 |
24.1 |
| Prince Edward Island |
36.4 |
31.8 |
40.0 |
28.6 |
33.3 |
42.1 |
46.2 |
| Nova Scotia |
32.5 |
32.0 |
27.1 |
30.6 |
28.6 |
33.1 |
29.8 |
| New Brunswick |
35.8 |
23.3 |
26.1 |
28.2 |
29.7 |
30.5 |
28.8 |
| Quebec |
17.7 |
20.0 |
20.4 |
20.0 |
24.0 |
26.5 |
23.0 |
| Ontario |
25.3 |
28.1 |
30.0 |
27.2 |
28.6 |
31.5 |
32.8 |
| Manitoba |
27.7 |
25.5 |
28.9 |
28.1 |
33.1 |
30.0 |
29.9 |
| Saskatchewan |
26.2 |
32.2 |
30.6 |
32.4 |
29.2 |
29.7 |
31.9 |
| Alberta |
47.9 |
40.5 |
39.0 |
48.1 |
39.6 |
39.9 |
43.0 |
| British Columbia |
35.3 |
33.7 |
33.1 |
39.0 |
38.6 |
36.6 |
34.6 |
| |
|
|
|
|
|
|
|
| Attached without Children |
|
|
|
|
|
|
|
| Canada |
26.5 |
27.2 |
27.2 |
25.2 |
24.9 |
23.5 |
21.1 |
| Newfoundland and Labrador |
23.8 |
23.1 |
25.0 |
23.2 |
21.3 |
23.3 |
17.7 |
| Prince Edward Island |
33.3 |
20.0 |
50.0 |
33.3 |
25.0 |
50.0 |
33.3 |
| Nova Scotia |
37.2 |
38.6 |
26.7 |
34.0 |
32.6 |
28.3 |
25.6 |
| New Brunswick |
32.7 |
33.3 |
26.7 |
25.0 |
22.4 |
26.3 |
18.5 |
| Quebec |
18.1 |
22.4 |
22.2 |
19.5 |
20.7 |
19.7 |
17.3 |
| Ontario |
27.4 |
28.1 |
28.5 |
26.0 |
26.2 |
25.3 |
23.2 |
| Manitoba |
31.9 |
23.1 |
25.0 |
23.1 |
32.4 |
18.5 |
32.0 |
| Saskatchewan |
28.1 |
27.3 |
30.0 |
27.6 |
26.7 |
27.3 |
28.6 |
| Alberta |
47.8 |
38.0 |
36.6 |
40.2 |
26.9 |
24.4 |
27.2 |
| British Columbia |
35.1 |
33.5 |
34.8 |
34.6 |
32.7 |
29.2 |
24.8 |
| |
|
|
|
|
|
|
|
| Lone Mothers |
|
|
|
|
|
|
|
| Canada |
12.4 |
12.2 |
15.2 |
16.1 |
17.4 |
20.3 |
21.4 |
| Newfoundland and Labrador |
15.7 |
8.9 |
11.9 |
11.3 |
13.0 |
16.2 |
12.4 |
| Prince Edward Island |
18.5 |
16.0 |
21.6 |
19.2 |
19.6 |
27.1 |
29.0 |
| Nova Scotia |
9.6 |
9.2 |
11.4 |
10.7 |
11.4 |
16.3 |
16.4 |
| New Brunswick |
21.4 |
16.8 |
15.4 |
13.5 |
16.7 |
20.1 |
16.9 |
| Quebec |
9.2 |
10.0 |
12.6 |
12.4 |
16.8 |
18.0 |
18.1 |
| Ontario |
9.4 |
10.6 |
14.6 |
15.5 |
16.1 |
20.8 |
24.3 |
| Manitoba |
15.3 |
15.7 |
15.9 |
18.1 |
17.5 |
23.2 |
21.2 |
| Saskatchewan |
17.2 |
17.3 |
19.6 |
18.7 |
20.5 |
18.9 |
18.9 |
| Alberta |
28.8 |
23.8 |
26.2 |
32.8 |
28.6 |
31.2 |
31.5 |
| British Columbia |
14.6 |
14.0 |
16.6 |
19.4 |
21.1 |
19.9 |
19.2 |
Alberta is a different sort of outlier, experiencing an unusually large decline
in exits from 34.8% in 1992 to 15% in 2000. After 1993, Alberta tightened entry
conditions and it become more difficult in particular for school-leaving adolescents
to gain access to welfare. Instead, many such individuals were re-routed back
to school. The pool of SA participants (who did not go back to school) would
likely have had a lower level of human capital after 1993, and exit rates fell.
Nonetheless, the net result was for Alberta to have by far the lowest SA participation
rates among singles by the end of the decade.
Couples with children at the national level experienced broadly upward-trending
exit rates. But again there are significant provincial differences. Quebec
and Newfoundland have the lowest exit rates, and Alberta by far the highest
(although with no increase over time). The other provinces have had a fairly
uniform pattern of moderately rising rates over time. The differences in
exit rates between provinces are large, on the order of two-to-one.
With consistently low exit rates over time and high (although
declining) entry rates, the change in incidence for couples with
children in Newfoundland was well above the other provinces. Conversely,
with Alberta’s consistently high exit rates, it was a large
decline in entry rates from 1.1% to 0.5% that drove its decline
in incidence to uniquely low levels by 2000. Ontario’s significant
decline from relatively high to relatively low levels was driven
by a moderate rise in exit rates and large decreases in entry.
Quebec’s low exit rates were the main contributor to its
relatively high incidences in the later years. More or less average
levels and trends in entry and exit dynamics drove the other provinces.
For couples without children, virtually every province experienced a modest
decline in exit rates. This group thus appears more akin to singles than
couples with children, in that the general trend in exit rates is slightly
downward.
Newfoundland’s high welfare rates, especially in the later years, are
clearly driven by the trends in both its very high entry and relatively low
exit rates. A similar story holds for Quebec, except that its particularly
low exit rates play a more significant role in this dynamic. Ontario’s
movement from relatively high to relatively average participation rates is,
in contrast, driven almost entirely by its declines in entry rates. Its exit
rates remain in the middle rank, declining moderately over time. Alberta had
the highest exit rates in the early years, but the largest drop over time.
Its low incidence is the result of a combination of their generally low entry
rates and high (though declining) exit rates.
For lone mothers, exit rates increased in all provinces from 1993 onwards,
making them resemble couples with children (rather than singles or couples
without children, whose rates declined). Alberta’s rates are again
the highest, with Newfoundland and Quebec among the lowest. Ontario showed
the largest increase over time.
Ontario’s decrease reflects a combination of both higher
exit and lower entry side factors, while Newfoundland’s increase
also was driven from both sides. Alberta’s dramatic declines
in incidence reflected mostly an increase on the exit side, not
less entry.
Conclusion
The incidence and entry rates of welfare peaked in the early 1990s,
and then declined sharply over the rest of the decade for all family
types (singles, couples with children, couples without children,
and lone mothers), although these declines varied considerably.
Exit rates, in contrast, differed much more across family types:
couples with children and lone mothers saw increases, whereas unattached
individuals and couples with no children experienced a decline.
All these rates differed significantly by province in magnitude,
timing and even the direction of change.
One important caveat is that the analysis did not attempt to disentangle the
specific factors that have generated the observed patterns. In particular,
we have not sought to explain whether the results are predominantly due to
the tightening of rules and regulations and reductions in benefit levels,
or whether they are more due to the improved economic conditions over this
period.
Recent feature articles
* Business and Labour Market Analysis (613)
951-3962.
|


