|
|
| |
Information identified as archived is provided for reference, research or recordkeeping purposes. It is not subject to the Government of Canada Web Standards and has not been altered or updated since it was archived. Please "contact us" to request a format other than those available.
 |
11-010-XIB |
||||||||||||||||||||||||||||||||||||||||||||||||||||||||||||||||||||||||||||||||||||||||||||||||||||||||||||||||||||||||||||||||||||||||||||||||||||||||||||||||||||||||||||||||||||||||||||||||||||||||||||||||||||||||||||||||||||||||||||||||||||||||||||||||||||||||||||||||||||||||||||||||||||||||||||||||||||||||||||||||||||||||||||||||||||||||||||||||||||||||||||||||||||||||||||||||||||||||||||||||||||||||||||||||||||||||||||||||||||||||||||||||||||||||||||||||||||||||||||||||||||||||||||||||||||||||||||||||||||||||||||||||||||||||||||||||||||||||||||||||||||||||||||||||||||||||||||||||||||||||||||||||||||||||||||||||||||||||||||||||||||||||||||||||||||||||||||||||||||||||||||||||||||||||||||||||||||||||||||||||||||||||||||||||||||||||||||||||||||||||||||||||||||||||||||||||||||||||||||||||||||||||||||||||||||||||||||||||||||||||||||||||||||||||||||||||||||||||||||||||||||||||||||||||||||||||||||||||||||||||||||||||||||||||||||||||||||||||||||||||||||||||||||||||||||||||||||||||||||||
Feature article
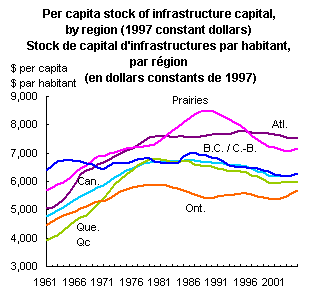
From roads to rinks: Government Spending on Infrastructure in Canada, 1961 to 2005by Francine Roy * Government-owned infrastructure capital constitutes an array of structures and networks that is the foundation for many human and material activities that are needed for economic growth and are essential to our lifestyle1. Its role is to enable people, goods and ideas to circulate or to ensure access to everyday essentials, such as good water, security and recreation facilities. Since infrastructure is so fundamental to our society, it is not surprising that media attention in recent years has been focused on the collapse of bridges and overpasses and the rupture of water mains in Canada and the US. This article analyses government investment in infrastructure by different levels of government and type of asset by region.2 The overall growth of government-owned infrastructure3 has been very similar across most regions over the past forty-four years. With the exception of the Atlantic provinces, the range of average annual capital growth from one region to the next is very narrow, falling between 1.8% and 2.2%4 since 1961. However, the growth of infrastructure capital varies considerably by region for different periods, different levels of government and different types of assets. The differences in provincial economies, cultures and values reflect specific needs and priorities for each region. Demographics, resources, economic conditions and special events (such as the Olympics) have also played a role in regional differences. Cycles in the growth of infrastructure investment are partly related to demographic changes, notably the birth of the boomer generation and their aging. Infrastructure spending surged during the 1960s and 1970s, when the needs of a rapidly-growing population were easily-met by strong economic growth. A slowdown in population and economic growth and high budget deficits led to a sharp curtailment of infrastructure spending in the 1980s and 1990s. Since 2000, governments have increased their infrastructure capital more than at any time since the golden years of the 1960s and 1970s. This renewed emphasis on infrastructure was reflected in the creation of Infrastructure Canada in 2002. However, the growth has not been strong enough to prevent more and more signs of wear in our infrastructure (the data are net of depreciation and in constant dollars). This is due to cuts in the 1990s when governments were grappling with significant budgetary deficits, as well as many of the assets built in the post-war infrastructure boom reaching the end of their life span. Every region experienced a decline in its infrastructure capital during this decade, with the exception of Ontario and British Columbia. One result has been much-publicized problems with our infrastructure. Over time, capital investment in every region has shifted from the federal to provincial and especially to municipal governments. In some regions, provincial governments took the lead in spending, while in others it was municipal governments. Overall, however, the growth of infrastructure by all levels of government slowed over time everywhere in Canada until the 2000s, when it began to recover. The per capita level of infrastructure by asset type as well as its growth rate are examined throughout this paper, because the two together present a more complete picture. The per capita measures better reveal the values and priorities of each region, and show the greatest differences in infrastructure by asset type among regions. Overall trends by regionCanada is a diverse federation with each province having different fiscal capabilities. This fiscal capacity is partly ‘equalized’ by federal-provincial transfers and other spending programs, although each jurisdiction is free to decide where to focus its spending. The distribution of infrastructure assets by region provides one measure of each region’s priorities. Canada’s provinces differ in their economic, social, cultural and geographic landscape. These differences are reflected in the growth of the individual components of infrastructure capital in the regions over time. These differences became more pronounced after 1980, when increasing fiscal restraint forced governments to more clearly establish their priorities. The annual average growth in the volume of infrastructure (in 1997 dollars) was quite similar at about 2% across most regions between 1961 and 2005 (Table 1). It rose slightly more in British Columbia and Ontario (Figure 1a). Growth rates were higher before 1981 than after: indeed, infrastructure capital fell outright in the Atlantic, Quebec and Prairies provinces in the 1990s. Only Ontario and BC did not cut infrastructure in the 1990s, and they led the upturn in the 2000s (when infrastructure capital rose an average 2.8% a year in Ontario and 1.1% in British Columbia). Quebec and the Prairies were not far behind. The Atlantic provinces were the only ones where infrastructure capital continued to decline in the 2000s, falling 0.5% per year. Still, for all regions the infrastructure per capita in 2005 was below its previous peak. On a per capita basis, the less urbanized regions, specifically the Atlantic and Prairie provinces, are better equipped than Quebec and Ontario in terms of the stock of infrastructure capital (Figure 1b). This is partly explained by the fact that overall the centre of gravity of infrastructure capital followed that of population in gradually shifting from the east to the west of the Ottawa River between 1961 and 2005. The Atlantic region rose to first place on a per capita basis only because its population fell significantly, since its infrastructure spending in absolute terms was the weakest of any region. Figure 1a
Figure 1b
Table 1 Average annual growth of total government infrastructure capital by region and period, in 1997 constant dollars
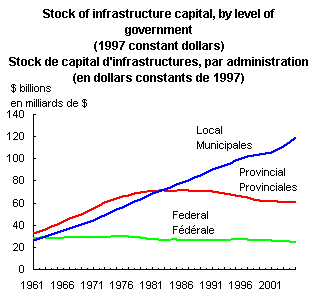
By level of governmentAll three levels of government spend significantly on infrastructure. Every region showed a relative decline in the ownership of capital by the federal and the provincial governments relative to the municipal level (Figure 2). This shift was more marked in Ontario and Quebec. In Ontario, 67% of government-owned capital in 2005 belonged to municipalities, compared to 38% in 1961. In Quebec, where the provincial government’s share fell the most, the decline was twice as steep as for the country overall, from 49% to 33% (see Table A.1 in the Appendix). By comparison, in Prince Edward Island, it was only 17% in 2005 versus 4% in 1961. Figure 2
Decentralization occurred across many types of asset throughout the period under study. The federal government cut its investments in a wide range of assets (Table A.2 in the Appendix). At the same time, local governments boosted their investments, notably in roads and the environment. By type of assetThis section shows that infrastructure growth differed across regions in terms of the type of assets (Table 2). These differences, as subsequent graphs will show, were sharpened after 1980 when the funds available for infrastructure slowed. Every region showed differences in spending by asset type because their distinct economies, cultures and values required different needs and priorities: BC focused on the environment, as well as recreation and engineering works in view of the upcoming Olympic games; culture and security were a priority in Quebec; sport complexes, water and roads in Ontario; marine construction (such as irrigation) in the Prairies; and institutional buildings (such as training centers) in the Atlantic provinces. Table 2 Average annual growth of total government infrastructure capital by region and type of asset, in 1997 constant dollars, 1961 to 2005
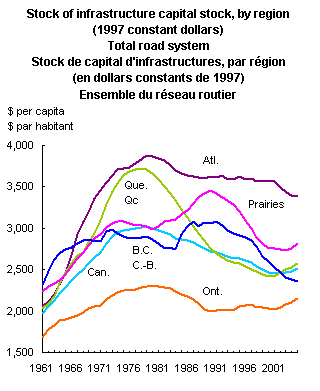
The detailed asset types are regrouped to correspond to the following overall functions, listed in order of their importance to infrastructure capital in 2005: road infrastructure (including bridges and overpasses), which account for almost 40% of all infrastructure capital; environmental protection and the water supply, which together represent nearly one-quarter of all infrastructure; office buildings, which embody approximately 10% of total capital; and the remaining assets, which each account for about 5% or less of all capital, including culture and recreation (notably sports facilities); marine construction and transportation and communications equipment; institutional buildings; security; commercial buildings and engineering works; and research laboratories (Table A.3 in the Appendix).5 The regional data are mostly presented on a per capita basis (in constant 1997 dollars), which also help adjust for the effect of a slowdown in population growth (from 1.9% in the 1960s to 1.1% in the 1990s, before recovering to 1.3%). (i) The road system The development and operation of road infrastructure are essential to the movement of people and goods and drives a large proportion of the economy. It falls mostly under the government’s responsibility. Thus, it is not surprising to see that roads and bridges make up the bulk (39.9%) of the government-owned stock of infrastructure. The provincial and municipal governments own the road system in about equal proportions. The stock of road infrastructure per capita (in 1997 dollars) increased significantly between 1960 and 1980, but has been eroding since then, falling to $2,511 in 2005 from its peak of $3,019 in 1979. From 1995 to 2000 it fell an average of $322 million a year. Governments have boosted the flow of investment in roads from $4.3 billion in 1998 to $7.3 billion in 2005, but this has barely offset the erosion of the road system. Figure 3
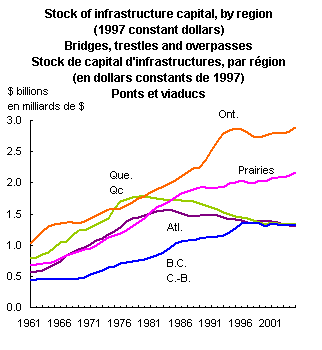
Quebec’s road capacity grew rapidly during the golden years of infrastructure spending in the 1960s and 1970s, but has also dominated the decline in subsequent years (Figure 3). In the 1960s and 1970s, with the arrival of Expo and the Olympics, a whole new road network took shape, including the Decarie Expressway6 and the Louis-Hippolyte Lafontaine tunnel under the St Lawrence River (the longest underwater tunnel built in Canada since the 1930s). By the late 1970s, Quebec had invested at least as much in its road system per capita as any region in Canada (see Figure 3). In the late 1970s, highway construction started to decline in Quebec. Lower investment spending and steady depreciation resulted in a significant decline in its net capital stock in roads over the next two decades, far more than in any other part of the country. In terms of bridges and overpasses (Figure 4a), Quebec invested so little that the capital stock fell in absolute terms, tumbling from the most in Canada in the late 1970s ($1.6 billion) to reach, at $1.3 billion, approximately the same level as British Columbia and the Atlantic provinces and below even the Prairies (despite Quebec having the largest land mass among all of the provinces at more than 1.5 million square kilometres7, or one quarter of all Canada’s territory). Since 2001, its capital stock in roads has started to recover. The average age8 of bridges and overpasses in Quebec also has risen constantly since 1976, becoming older than those of any of the other provinces. While Quebec’s territory is similar in size to the Prairies, more than half of Quebec’s exports travel by road, far more than in the Prairie provinces. Trade rose significantly after NAFTA, and the number of total vehicles registered in Quebec almost doubled after 1975. Road construction on the Prairies took off in the 1980s. Government-owned road infrastructure per capita in the Prairies continued to rise until the end of the Olympic games in Calgary. It then fell, with Alberta and Saskatchewan reducing their investments in roads the most. Low investment in roads on the Prairies can be associated with industrial demand shifting from roads in favour of trains and pipelines for the transportation of grains and oil and gas. British Columbia did not raise its investment in the road system to keep pace with its population after Expo 86. Ontario is the only part of the country where the capital stock in roads continued to rise throughout all four decades. Ontario spent less on government-owned road infrastructure than Quebec until the mid-1980s (figure 4b). After that, it moved ahead of Quebec. The rise in the capital stock in the road network was nearly twice as large in Ontario as in Quebec between 1961 and 2005. The Atlantic provinces stand out as strong investors in their road system, perhaps because of the importance of tourism. Its per capita road infrastructure is well ahead of the other regions. Between 1961 and 2005 the governments of New Brunswick and Prince Edward Island injected at least half of their total infrastructure budgets into the road system. The high level of investments in roads and bridges in Prince Edward Island is largely attributable to the construction of the Confederation Bridge connecting the island to the continent in 1997. Figure 4a
Figure 4b
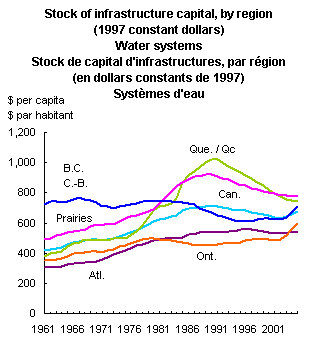
(ii) The environment and water systems The environment and water systems represent over one-quarter of government-owned capital, with 14.5% for the environment (largely waste water treatment systems and garbage) and 10.8% for water systems (largely for the supply of drinking water). Canada has an abundance of water, ranking second to Finland in terms of the volume and diversity of its water riches per capita, according to a UN report. While Canada barely represents 0.5% of the world’s population, it has close to 20% of all freshwater reserves9. While provincial and municipal governments share ownership of the roads, environmental management and the management of water systems mainly takes place at the local government level. Municipalities account for more than 80% of capital spending in these areas by supplying a wide range of government-owned infrastructure, mainly pumping and filtration systems and water storage and distribution networks. As with roads, environmental and water system assets rose significantly between 1961 and 1981. Like roads, most regions experienced decreases thereafter. British Columbia (Figures 5a) has the most government-owned infrastructure per capita related to the environment, while Quebec has the least. The Atlantic provinces have invested the most in waste management per capita. The presence of this capital may have encouraged the development of its recycling programs10. Nova Scotia is the province whose residents recycle the most in Canada, at 157 kilograms per person, ahead of second-place British Columbia. Figure 5a
Figure 5b
Figure 6
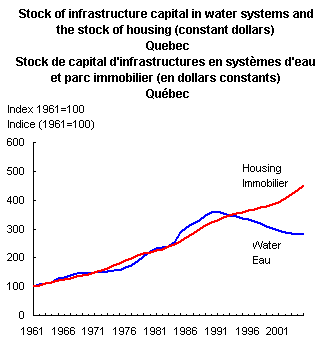
Investment in water systems has barely compensated for the ageing of existing equipment from 1993 to 2002. In fact, as shown in Figure 7a, investment in water systems outside of Quebec kept up with the increase in domestic demand (as indicated by the change in housing stock) only between 1961 and 1965. This was followed by a shortfall, which widened in most parts of Canada until recently. In Quebec, the pattern was different from the other regions (Figure 7b). Quebec made a massive investment in this sector in the 1970s and 1980s, far more than any other part of Canada. Figure 7a
Figure 7b
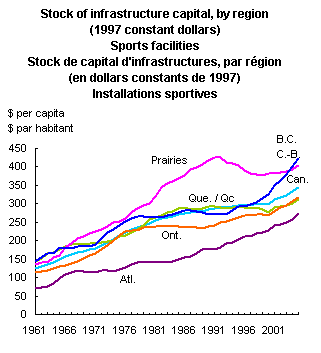
(iii) Office buildings In order of magnitude, the road and the environment and water systems are followed by office buildings, which represent 9.2% of the total value of government-owned capital. This type of asset dominates federal infrastructure, with 30.9% of its capital in 2005, ahead of institutional buildings (12.7%) and security (11.2%). Federal office buildings have become a larger part of total federal capital, up strongly compared with 16.3% in 1961. This is one of the few types of federal asset to have risen steadily in absolute terms between 1961 and 2005, reaching $7.6 billion in 2005 out of a total of $24.5 billion (in constant 1997 dollars). Ontario, with the presence of the capital in Ottawa, accounted for 37.8% of these buildings: still, this placed it behind the Prairies, which passed it in 2003 on a per capita basis. The Atlantic provinces are well ahead in first place, with per capita investment twice as high as in Ontario. On a per capita basis, the value of office buildings fell by 38.2% in Ontario between 1961 and its low in 1997, tracking a long period of fiscal restraint. Almost half of this loss was later recovered, reflecting a building boom in the Ottawa area. Between 1997 and 2005, the value of office buildings rose from $2.1 to $2.9 billion (in constant 1997 dollars). (iv) Recreation and culture Recreational facilities provide important gathering places in society. They draw thousands of participants from every level of society to indoor and outdoor sports facilities such as arenas, skating rinks, stadiums, curling arenas, swimming pools and Olympic facilities. These facilities are also used as concert and meeting halls. Cultural facilities include public libraries, historical sites, museums and theatres. Sports facilities and cultural capital are the asset types that increased the fastest in percentage terms (Table 2), rising 3.7% and 3.8% respectively per year between 1961 and 2005. While there may be a widespread impression that we are spending more time at work and that the leisure society is but an illusion, the population as a whole is working far fewer hours now than it did 40 years ago. Just since 1989, the average work week decreased by nearly 2 hours, from 35.7 to 33.9 hours a week. For the total population aged 15 or over, time spent alone increased by 34% between 1986 and 1998 (from 4.4 hours in 1986 to 5.9 hours per day in 1998) 11 and has continued to rise since then12. Local governments played the biggest role by far in these infrastructure expenditures. The provincial contributions were much smaller than the municipal ones, and decreased over time. Figure 8
Overall, however, sports facilities represented a relatively small portion (5.5%) of total infrastructure capital. Per capita, their stock in constant 1997 dollars amounted to slightly more than $300 in 2005. The capital stock in sports facilities decreases moving from west to east, from $422 per capita in British Columbia to $403 in the Prairies, $317 in Ontario, $311 in Quebec and $274 in the Atlantic provinces. The dollar amounts were higher out west, as international events such as the 1988 Olympic games in Calgary were relatively recent and, as a result, the facilities depreciated less than in the east, where they were older. Moreover, the Vancouver games already have started to accelerate their level in BC. The 1976 Olympic games in Montreal had increased Quebec’s capital stock. The Atlantic provinces are well behind the other regions in this regard, having never hosted a major international sports event. Also, the Atlantic provinces are the only ones in the country without a major sports team. It is in Quebec that culture infrastructure capital is most prominent. Figures 9a and 9b illustrate the gap between Quebec and much of the rest of Canada that has developed since the mid-1980s. Between 1961 and 2005, culture was (with office buildings) the only area of government investment for which Quebec was well ahead of the growth in government-owned capital infrastructure in the rest of the country. In 2005, British Columbia was closing in, followed by the Atlantic provinces, the Prairies and Ontario. Figure 9a
Figure 9b
Quebec increased its investments in cultural facilities much more than in sports facilities, the opposite of most regions elsewhere (British Columbia increased its investments equally in both). Nonetheless, culture is only a small share of government-owned capital in Quebec as elsewhere. Culture capital is approximately $100 per capita for public libraries, museums, theatres and historical sites. After 2000, the growth of culture capital fell behind roads in Quebec for the first time ever. The Atlantic provinces posted growth about equal to the national average for both recreation and culture. Nonetheless, per capita, they lagged well behind the national average over the four decades, since they started from the lowest level. (v) Marine construction and other transportation and communications equipment Assets related to marine construction and other transportation and communications equipment accounted for most of the federal government’s investment slowdown between 1961 and 2005, and weighed heavily on the growth of all government-owned capital during the period under study (Table 3). The federal government cut back by 1.5% a year on average its capital in this type of asset since 1961. Table 3 Average annual growth of federal government infrastructure capital by region and type of asset, in 1997 constant dollars, 1961 to 2005
Marine construction largely includes irrigation, wharves, docks, terminals, breakwaters, canals and works along shorelines. The decline, particularly for wharves, docks and terminals, occurred across the country, but mostly in the Prairies (-2.4%). The other levels of government more than compensated for the drop only in the Prairies and Ontario, especially for work on canals and shorelines. In the Prairies, municipalities invested heavily in this sector, where it represented more than 5% of capital held by all levels of government. This boosted infrastructure capital to close to $2 billion in 2005 in irrigation work and shorelines (including the Greater Winnipeg Floodway built in the 1960s), as well as canals. The decrease in expenditures on federal infrastructure offset increases in this area by the provincial and municipal governments in Quebec and British Columbia. Figure 10
In the Atlantic provinces, all levels of government combined spent an average 0.5% less annually. However, this data does not capture investments by Crown corporations. The decrease in the Atlantic provinces occurs just as the Marine Atlantic Inc Crown corporation was set up, with a mandate to run a marine transportation service under contract with Transport Canada. Nonetheless, the capital stock for the transportation industry illustrates that for the country as a whole, this infrastructure showed a slight downward trend per capita (this data is confidential on a provincial basis). Other transportation equipment includes aircraft storage, railway tracks and passenger terminals. The infrastructure in these assets fell an average of 1% annually for the federal government. However, the other levels of government did not make up for these losses, and total government assets fell by less than 1% annually (part of the decline reflects the privatization of assets). This asset type accounts for less than 1% of total government-owned assets. The federal government also reduced its investments in communications, but the private sector stepped up its investments in this area, at least until the Internet bubble burst in 2000. (vi) Research laboratories and engineering The federal government, which is the major stakeholder in this type of asset, just barely maintained its investments in research laboratories. However, there are strong regional variations. While such capital rose an average of 1.7% annually in Quebec and 1.4% annually in the Prairies, it fell by 2.3% in British Columbia. Most of the engineering work was done by local administrations, which boosted the overall capital stock, especially in British Columbia, where this capital grew by 5.3% a year. (vii) Institutional and commercial construction While the three levels of government share ownership of this type of capital more or less equally, here again the federal government slowed its capital outlays since 1961. Federal capital growth in institutional buildings (which include veterans’ hospitals, training and day care centres) rose only 0.3% annually, compared to 2.1% for all levels of government. Commercial capital (warehouses and garages) decreased by 1.1% annually, with Quebec, Ontario and British Columbia reporting the strongest declines. At the same time, the Atlantic provinces reported higher growth for institutional and commercial construction than the Canadian average. (viii) Security Security-related assets include penitentiaries, detention homes and courthouses. They represent only 3.1% of the value of total government-owned capital. However, for all provincial and federal governments combined, security-related capital has been the main contributor to overall growth since 1961, after roads and office towers. Regionally, there was a shift in capital towards Quebec and the Atlantic provinces, where the provincial governments invested a great deal. Ontario’s investment was the lowest per capita. Figure 11
SummaryWhile Ontario reported a rate of increase in total infrastructure spending similar to the national average for the entire 1961-2005 period, it moved ahead considerably beginning in 2000. Its infrastructure expenditures rose in most areas, led by roads, water supply, recreational and office towers. Quebec quickly moved from last place in terms of infrastructure capital per capita in 1961 to equal the Canadian average with the 1976 Olympic games, moving well ahead of Ontario during that decade due to roads and culture. While growth remained positive for culture, two decades of eroding investment in roads lowered infrastructure capital. Capital recovered in the 2000s, led by commercial construction and research laboratories, while spending on roads moved ahead of culture for the first time ever. Given its slow population growth, the Atlantic provinces were almost nose to nose with the Prairies for the lead in government-owned infrastructure per capita. Government-owned infrastructure in absolute terms continued to decrease in the 2000s in the Atlantic region, unlike the other parts of the country. These declines were mainly in marine construction, transportation equipment and communications, which offset gains in roads and institutional buildings. The Prairies took the lead in per capita investment in infrastructure during the 1980s due, among other things, to the 1988 Olympic games in Calgary. They slowed in the 1990s, with the decrease in oil revenues, falling behind the Atlantic provinces. Investment recently recovered as the price of oil rebounded. Infrastructure capital per capita in British Columbia was close to the national average for a large portion of the period under study, from 1971 to 2005. Recent growth has been strong in sports facilities and engineering works, boosted by the upcoming Olympic games. Table A.1 Share in total government infrastructure capital, 2005 and 1961, by region and level of government, in 1997 constant dollars
Table A.2 Average annual growth of government infrastructure capital by level of government and type of asset, in 1997 constant dollars, 1961 to 2005
Table A.3 Asset share in total government infrastructure capital, in 1997 constant dollars, Canada, 2005
Table A.4 Average annual growth of local government infrastructure capital by region and period, in 1997 constant dollars
Table A.5 Growth in government infrastructure capital by region, by asset type and period, in 1997 constant dollars
Notes
|
|
|
|