
Statistics Canada
www.statcan.gc.ca
Common menu bar links
International trade

Archived Content
Information identified as archived is provided for reference, research or recordkeeping purposes. It is not subject to the Government of Canada Web Standards and has not been altered or updated since it was archived. Please contact us to request a format other than those available.
If you want to see Canada’s international trade in action, a good vantage point is Vancouver’s Lions Gate Bridge. Looking east toward the Port of Vancouver, you’ll see freighters move toward their berths; looking west, other ships sit moored at the mouth of Howe Sound, waiting their turn to dock.
Vancouver is our busiest port. Most of the commodities passing through it are headed offshore, mainly to Asia. However, Canada’s trade travels by many other modes, such as truck, rail, air, pipeline and power line.
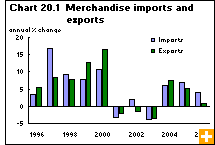
Canada exports more than it imports: in 2006, we exported $458.2 billion in goods, up 1.1% from 2005, and imported $404.5 billion, up 4.2% from 2005. We’ve posted a trade surplus every year since 1976.
In 2006, the value and volume of both our imports and exports reached record highs. This fits into a larger trend: world trade has grown as much since 1990 as it did in the prior 100 years, the result of international trade agreements, falling transportation costs, and the free flow of information, ideas and product orders.
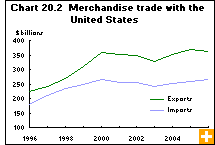
The United States remains our foremost trading partner by far, with China as our second largest trading partner. Trade flows to other countries shift over time. China surpassed Japan in 2003.
Our trade with China—Canada’s fourth largest export market and second-largest source for imports—has been expanding significantly. China has become a major importer and consumer of our raw materials and an exporting powerhouse. Lately, China’s manufacturers have shifted to making higher-value capital goods, such as computers and electronics equipment. Since 2003, Canada has imported more and more of these higher-value items from China than lower-value items, such as clothing and shoes.
As an exporter, Canada has benefited directly and indirectly from China’s industrial revolution. Indirectly, China’s demand for all sorts of industrial raw materials, especially energy and metals, has pushed up world prices. As a major raw materials producer, Canada has enjoyed these higher prices, whether we sell those commodities to China or to another nation.
In 2006, the United Kingdom edged out Japan as Canada’s second largest export market. Growth in exports to Japan remained subdued, but climbing metal prices—a trend in recent years—pushed up the value of exports of gold, uranium and nickel to the United Kingdom.
What goes out: Commodities are still key
Before there was a Canada, there was the fur and timber trade. Britain’s Royal Navy used Canadian timber for the masts of the ships it built to fight Napoleon in the early 1800s. Until the start of the Second World War in 1939, two-thirds of Canada’s exports were grain and lumber.
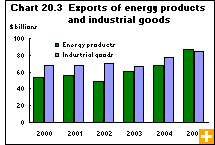
Resources are still critical to our trade. Agricultural, fish and forestry products, energy, metals, chemicals and fertilizers accounted for about half our exports in 2006. Companies engaged in natural resources extraction flourished last year, save for those in lumber, an industry dogged by a slump in U.S. housing.
In Western Canada, higher export receipts for crude petroleum and metal products yielded unprecedented prosperity; in Quebec and Ontario, strong metal exports offset losses in the forestry and automotive sectors. Newfoundland and Labrador’s exports rose because of higher iron ore and energy products shipments.
Metal and metal ore exports led the gain in exports in 2006, climbing to $45 billion. Prices for copper, zinc, gold, aluminum, nickel, potash and uranium all advanced in 2006. The United Kingdom was the largest market for Canadian metals outside of the United States, followed by China, Japan, Norway, South Korea and the Netherlands.
Crude petroleum exports were also up in 2006, reaching a new record of $39 billion, no small feat given the spike in prices in the fourth quarter of 2005 following the hurricanes in the Gulf of Mexico. In contrast, exports of forestry products fell in 2006 for the second consecutive year, to $33.5 billion. This was down from $40 billion in 2004, a year in which lumber prices skyrocketed.
Exports of automotive products have also dipped in recent years while auto imports from overseas have been rising. In 1999, the auto sector’s trade surplus was second only to that of forestry products at $21 billion; by 2006, the auto sector’s surplus was $3 billion.
What comes in: Capital goods and consumer goods
The boom in the Western provinces made headlines as oilsands construction expanded and people flooded in to capitalize on the higher wages brought about by a tight labour market. Higher profits for businesses and incomes for individuals brought about a rapid expansion in investment and consumer purchases. This heightened demand pushed up imports of machinery, electronics, cars and trucks, home furnishings and clothing.
Imports of industrial machinery poured into the Western provinces in 2006, contributing to the 3% gain to $114.7 billion in machinery and equipment imports. The stronger dollar, which translated into lower import prices, combined with high crude oil and metal prices, drove business profits up and encouraged this inflow of capital goods.
The rise in household incomes stimulated consumer spending in 2006, with Alberta in particular driving auto sales to their highest level ever. The increase in sales was concentrated in Japanese and German models manufactured outside of North America, raising automotive import values.
The renovation and design industry has become big business, and the imports tell the tale. In 2006, Canadians imported a record high value of home furnishings, totalling nearly $8.0 billion. In addition to redecorating with fabric and furniture, high definition televisions were in brisk demand. Over $1.3 billion worth of them, imported primarily from Mexico but also from China, made their way into Canadian electronics stores in 2006.
In addition to dressing the home, clothing imports have been on the rise in recent years, a result of the lifting of import limits. In 2006, imports were up 6.5% to $8.3 billion in spite of falling clothing prices. In real terms, i.e., adjusting for the price drop, clothing imports were up 11% to $9.6 billion. Demand was also higher for personal electronics equipment, mostly originating in China, South Korea and Malaysia—in particular, cellular phones and personal digital assistants, which are devices that make music, photos, e-mail and the internet available at our fingertips.
