
Statistics Canada
www.statcan.gc.ca
Common menu bar links
Ethnic diversity and immigration

Archived Content
Information identified as archived is provided for reference, research or recordkeeping purposes. It is not subject to the Government of Canada Web Standards and has not been altered or updated since it was archived. Please contact us to request a format other than those available.
Over the past 100 years, more than 13 million immigrants have arrived to forge a new life here, making Canada one of the world’s most ethnically diverse countries. Most came from Europe during the first half of the twentieth century. Later on, non-Europeans started arriving in larger numbers as economic immigrants or refugees, or as family members of previous immigrants.
By 1970, half of all immigrants were coming from Caribbean nations, Asia and South America. In the 1980s, a growing number were arriving from Africa.
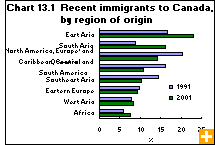
In the 1990s, 58% of Canada’s immigrants were born in Asia (including the Middle East); 20% were from Europe; and 22% came from the Caribbean, Central and South America, Africa and the United States. Most (73%) settled in Toronto, Montréal and Vancouver, transforming the ethno-cultural composition and socioeconomic dynamics of these cities.
In 2001, 10.3 million people—nearly half of Canada’s population aged 15 and older, not including Aboriginal peoples—reported British, French or Canadian ethnic origins, or some combination of the three, reflecting the long history of British and French peoples in Canada. Meanwhile, 4.3 million Canadians reported other European origins, 2.9 million reported non-European origins, while 3.3 million reported mixed ethnicity.
Visible minority population growing fast
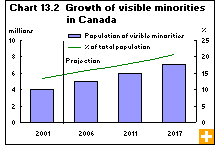
Canada’s visible minority population is growing much faster than its total population: 25% growth from 1996 to 2001 versus 4% growth in the general population. This is due largely to increased immigration from Asia, Africa, the Caribbean, Central and South America and the Middle East. In 2001, about 70% of the visible minority population was born outside Canada.
From 1981 to 2001, the number of visible minorities increased more than threefold from 1.1 million people, or nearly 5% of the population, to 4.0 million people, or 13% of the population. Chinese made up the largest visible minority group in 2001, followed by South Asians and Africans.
By 2017, about 20% of Canada’s population could be visible minorities, or anywhere from 6.3 million to 8.5 million people. Close to half are projected to be South Asian or Chinese. The highest growth rates are projected for West Asian, Korean and Arab groups, whose populations could more than double by 2017 but remain small relative to the South Asian, Chinese and African populations. In 2017, 95% of the visible minority population will live in a census metropolitan area (CMA), virtually unchanged from 2001.
Canada’s population is highly urban: 64% of Canadians lived in a CMA in 2001. The proportion of recent immigrants settling in a CMA rose from 84% in 1981 to 94% in 2001. The share of Canadian-born people residing in a CMA grew from 53% to 59%.
Recent immigrants prefer CMAs for many reasons: 41% cite a spouse, partner or family in the area; 18% cite proximity to friends. Others cite job prospects, educational opportunities, lifestyle and housing.
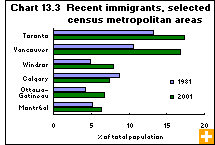
From 1981 to 2001, Canada’s five largest cities—Toronto, Montréal, Vancouver, Ottawa–Gatineau and Calgary—received much smaller shares of immigrants from North America, Western Europe and Oceania, but received larger shares from West Asia, South Asia and East Asia.
In Montréal, most recent immigrants have arrived from Haiti, Algeria, France and Lebanon. In Vancouver, more than half of recent immigrants in 2001 were from East Asia, with 62% of them coming from just five countries: China, Hong Kong, Taiwan, India and the Philippines.
By 2017, fully 49% of Toronto’s population could be immigrants, up from 44% in 2001. In Vancouver, the proportion is projected to rise from 38% to 44%.
Recent immigrants have strong ethnic ties
The strength of immigrants’ attachment to an ethnic group is related to their length of time in Canada. Recent immigrants often settle close to family and friends, who are more likely of similar ethnic background, which may contribute to a strong sense of belonging to their ethnic group.
Of immigrants who arrived here from 1991 to 2001, 71% rated at least one of their ancestral origins as important to their identity. This compares with 57% of second-generation Canadians (those born in Canada with at least one foreign-born parent) and with 44% of the third generation (those born in Canada to two Canadian-born parents).
Sense of belonging also varies by ethnic group. For instance, 78% with Filipino ancestry report a strong connection to their ethnic group, as do 65% of East Indians and 65% of Portuguese. But just 36% of Dutch, 33% of Germans and 33% of Ukrainians report a strong connection to their ethnic group. This likely reflects the longer time these latter groups have been in Canada.
Regardless of length of time here, immigrants are more likely than people born here to participate in ethnic or immigrant associations. Recent immigrants, however, are less likely to participate in other types of organizations in Canada.
