
Statistics Canada
www.statcan.gc.ca
Common menu bar links
Agriculture

Archived Content
Information identified as archived is provided for reference, research or recordkeeping purposes. It is not subject to the Government of Canada Web Standards and has not been altered or updated since it was archived. Please contact us to request a format other than those available.
The landscape on a Canadian farm might seem appealingly idyllic and unchanging, but agriculture as a business sees as much risk, change and disruption as any other.
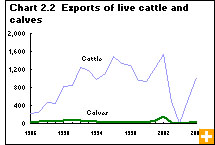
Recent disruptions in Canadian agriculture have affected only certain commodities: the BSE (bovine spongiform encephalopathy) crisis, for example, was devastating but mainly confined to the cattle industry.
Now, three major changes are pressing agriculture in Canada, and worldwide. Rising middle classes in other parts of the world can now afford to eat more food, especially animal protein. The global food supply has been further squeezed by recent droughts and other bad weather in key crop-growing areas. In North America, the push to grow corn, wheat and other feedstocks for the expanding ethanol fuel industry is having an effect.
Canada’s farmland is vast—about 167 million acres according to the 2006 Census of Agriculture—but ultimately a limited resource. A sudden rush to plant more of one crop displaces others, pushing up prices of those other commodities as well.
More acres planted in corn
In late 2006, corn demand and prices started to rise, pushed in part by the expanding corn-based ethanol industry, particularly in the United States. Responding to rising prices, farmers planted 3.4 million acres of grain corn in 2007, compared with 2.7 million acres in 2006. In 2008, farmers planted 3.0 million acres.
Canada’s biggest corn provinces are Ontario, with 58% of Canada’s corn acreage, and Quebec, with 35% in 2006.
Other grain crops valuable too
In the spring of 2008, prairie farmers were busy taking advantage of rising canola and wheat prices by planting record acreages of those crops. To make room for 14% more wheat acreage and 0.9% more canola acreage, they planted 19% less area in oats and 18% less in barley, which are lower-value crops that are often fed to livestock, as well as 5% less in grain corn, and left 21% fewer acres fallow for the season.
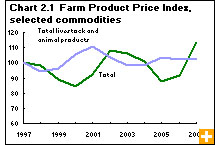
Rising prices, however, are just a recent development. In the first half of this decade, low commodity prices and rising costs for inputs, such as fertilizer, seed and pesticides, pushed farmers in many provinces to shift from annual crops, such as wheat and barley, to lower-cost perennial forages, such as alfalfa, tame hay and improved pasture. Grain prices dropped about 11% from 2000 to 2005, and years of either drought or flood presented other challenges. However, oilseed prices rose about 15% in that period: canola, in particular, has been gaining popularity among producers since the 1980s.
Prices received by dairy farms for their milk rose 19% from 2000 to 2005. Cattle prices, however, dropped over 11% from 2000 to 2005 because of the BSE crisis, bottoming out in 2004 with a 26% drop from 2000. When the borders were partly re-opened to Canadian cattle in 2005—and by the time the census was taken in May 2006—cattle prices rebounded somewhat from their lows.
That was then, this is now
Much has changed since then: farmers’ cash receipts from marketing their products totalled $40.6 billion in 2007, up 10% from 2006, and 15% above the 2002-to-2006 average, a period marked by the BSE crisis and low commodity prices.
But in agriculture, like in other diverse sectors, the aggregate numbers can conceal gainers and losers. The farm cash receipts’ rise was primarily driven by grain and oilseed prices. So, grain and oilseed farmers took advantage of strong prices by selling more product out of long-term storage. The value of crop sales, including grains and oilseeds, was up 25% from 2006 and 29% higher than the previous five-year average.
Livestock producers did not fare so well. In 2007, livestock receipts rose 2% from 2006 to $18.2 billion. Dairy, poultry and egg producers received more because of higher prices, although they faced higher feed costs. For cattle and hog producers, those feed costs were compounded by lower livestock prices in Canada and the higher Canadian dollar, which clouded their export prospects.
Farming near CMAs
Farming isn’t just a rural phenomenon: more than 35,000 farms, or 16% of the 229,373 counted in the 2006 Census of Agriculture, had their headquarters in one of Canada’s 33 census metropolitan areas (CMAs).
Farming in a CMA might evoke images of cornfields planted next to big-box malls, but in fact CMAs extend far out from the limits of the urban core, sometimes dozens of kilometres into the countryside. Being near a city poses some challenges for farming, but offers benefits too.
Urban areas offer a ready market for many farm products, a supply of labour (and some competition for it), and opportunities for farmers to diversify their income with off-farm revenue.
Farmland in a CMA is likely more valuable than that in regions farther away from the city, making it more expensive to own land for farming: taxes may be higher, for example. Agriculture competes with other economic interests for land: farmland often becomes segmented into smaller tracts, making it more difficult to work. Neighbours’ complaints over farming practices create friction.
High land values and proximity to markets make CMAs a good fit for greenhouse, nursery, and floriculture operations. Fruit and vegetable operations are also more common in CMAs. Livestock and field crop farms are less common in CMAs than in rural areas.
Organics we don’t see
Canadians regularly see organically grown fruits and vegetables in stores, but they do not see the majority of what is produced on the nation’s organic farms.
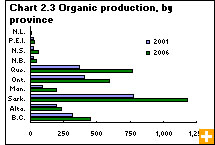
The most common type of certified-organic product grown on Canadian farms was hay and field crops, such as wheat and other grains, oilseeds, and pulses, such as lentils and chick peas. Some of those products are transformed into processed goods; others are fed to livestock. (Organically raised livestock of course must be given organic feed.) According to a study based on data from the 2006 Census of Agriculture, 2,462 farms reported growing organic hay and field crops, most of it for export.
In 2006, 916 of Canada’s 3,555 certified organic farms reported growing fruits and vegetables. ‘Organic farms’ are classified in the Census of Agriculture in three groups: certified organic by a certifying agency; organic but not certified; or in transition to becoming certified. Nearly 12,000 farms reported producing organic but non-certified products; another 640 farms were in the process of becoming certified.
Organic farms make up 2% of Canada’s 229,373 agricultural operations.
