
Statistics Canada
www.statcan.gc.ca
Common menu bar links
Education, training and learning

Archived Content
Information identified as archived is provided for reference, research or recordkeeping purposes. It is not subject to the Government of Canada Web Standards and has not been altered or updated since it was archived. Please contact us to request a format other than those available.
Education represents the second largest sector in Canada’s economy as measured by the government funding allocated to it. From 1999 to 2008, education spending by the various levels of government increased an average of 6% per year to $91.1 billion in current dollars. Only health sector spending grew faster over the decade.
Under the constitution, the provinces and territories are responsible for education and are the main source of its funding. The federal government funds the education of Aboriginal peoples on reserves, contributes to postsecondary education and supports other educational activities.
Total spending on elementary and secondary public schools in Canada rose 41% from $33.8 billion in 1999 to $47.5 billion in 2008. Meanwhile, $38.8 billion was spent in 2008 on postsecondary education, nearly a 90% increase from the 1999 spending level, which totalled $20.5 billion.
School population
The number of students enrolled in elementary and secondary public schools in Canada fell 3% from the 1999/2000 to 2005/2006 school years to 5.2 million children. Newfoundland and Labrador was the hardest hit province: it experienced a decline in enrolment of 18%, caused largely by ongoing migration to other provinces.
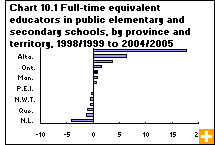
The introduction of provincial examinations in the 2000/2001 school year also contributed to a decline in enrolments. This downward trend was felt across the country, except in Alberta (1.4%) and Ontario (0.6%), where enrolment rates rose.
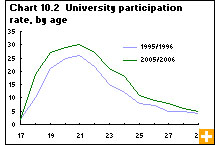
For a fifth straight year, universities posted record enrolment, with 1.0 million Canadian students in 2005/2006. Enrolment rose 3% from the previous year, the second lowest increase since 2000.
There continued to be proportionally more women than men in universities in 2005/2006. Women accounted for 58% of enrolled students, a proportion that has remained stable since 2001. According to a Statistics Canada study released in September 2007, the main factors explaining the gap in university enrolment between men and women are school performance (45%), work and study habits at age 15 (11%), parental education expectations (9%) and other factors (12%).
Educators
In 2005/2006, there were 329,315 full‑time (or equivalent) educators in elementary and secondary public schools. The term ‘educator’ includes not only teachers, but also all employees in the public school system who hold a teaching certificate, including principals, vice‑principals, educational advisors, guidance counsellors, and religious and pastoral advisors.
From 1998/1999 to 2004/2005, the student‑to-educator ratio in elementary and secondary public schools fell nationally from 16.5 to 15.9, which means there were fewer students per educator. Lower ratios occurred in all provinces and territories, except British Columbia. In 2004/2005, the number of students per educator ranged from lows of 13.6 in Newfoundland and Labrador and 11.5 in Yukon to the high of 17.5 in British Columbia.
Educators’ salaries accounted for about two‑thirds of all elementary and secondary education spending. The average pay of educators (in current dollars) rose from 1998/1999 to 2004/2005, rising from $53,569 to $64,553.
Graduates
Slightly fewer than 313,600 students graduated from public secondary schools in the 2005/2006 school year, up 3% from 1999/2000. This increase was mainly due to the elimination of Grade 13 in Ontario, known as Ontario Academic Courses. Excluding the students in this double cohort, there was little change in the total number of graduates in Canada from 1999/2000 to 2005/2006 (1%).
Universities issued a record 215,400 degrees, diplomas and certificates in 2005, up 2% from 2004 and 43,000 more than in 1998, which had the lowest number of graduates in the past decade. Approximately 172,700 undergraduate students completed their studies, up 2% from 2004. The number of students earning a masters degree rose 50% from 1998 to 2005, to 33,000 students. Some 4,200 students earned a doctorate degree in 2005.
Overall, women are more likely than men to receive a university degree: 128,600 women earned an academic qualification in 2005, or about 60% of all university graduates.
According to the 2004/2005 Survey of Earned Doctorates, 46% of doctorate holders are women. This marks an increase from 43% in 2003/2004. Although the overall gender gap has narrowed, there were still differences in 2004/2005, depending on the field of study. For instance, engineering remains a male‑dominated field, while psychology has become dominated by women.
The proportion of women who hold a doctorate has grown considerably in traditionally male‑dominated fields. For example, from 2003/2004 to 2004/2005, the percentage of women graduates in computer sciences and mathematics increased 49%. The number of women earning a degree in physics rose 23%.
The relatively high number of foreign male students in Canadian universities contributes to the gap between men and women in terms of doctoral degrees. If foreign students and students with visas are excluded from the data, the percentage of female graduates from a doctoral program is slightly higher than 50%.
Tuition fees
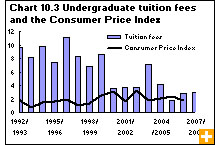
During the 2000s, the rise in tuition fees for undergraduate students slowed to an average of 4%. This slowing followed an average annual rate of increase of 10% throughout the 1990s.
Even with limited hikes, full‑time undergraduate tuition fees climbed on average faster than the Consumer Price Index. However, the gap between tuition fees and the general rate of inflation declined from 2001/2002 to 2007/2008.
Full‑time Canadian undergraduates paid an average of $4,524 in tuition fees for the 2007/2008 academic year, up from $4,400 in current dollars the previous year. In 1998/1999, they paid on average $3,064, compared with $1,185 in current dollars in 1988/1989.
In 2007/2008, full‑time graduate and doctoral students spent $5,447 on average on tuition fees, up 1% from the previous year, representing less than half the increase in fees of undergraduate students.
