
Statistics Canada
www.statcan.gc.ca
Common menu bar links
Government

Archived Content
Information identified as archived is provided for reference, research or recordkeeping purposes. It is not subject to the Government of Canada Web Standards and has not been altered or updated since it was archived. Please contact us to request a format other than those available.
Managing a country as large, diverse and dynamic as Canada presents a big challenge—just imagine delivering services to 33 million people who are spread across 10 million square kilometres.
The task is so large that it takes 3.2 million people working in hundreds of public sector organizations at three levels of government. Federal public servants process social security benefits such as Employment Insurance. Provincial public servants ensure that hospitals and clinics provide the health services Canadians need. Local government employees provide services such as the supply of safe drinking water, garbage removal, parks, policing and firefighting.
Most employees work at a provincial or local level
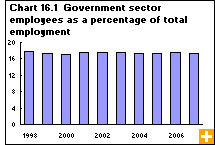
Provincial, territorial and local government employees make up the majority of public servants, and include general government (ministries and departments) as well as universities, colleges, school boards, and health and social service institutions. All told, these organizations account for about 80% of public sector employees, about 2.5 million people.
The federal government accounts for about 12% of all public sector workers. The remainder work in government business enterprises—in activities such as delivering the mail, selling alcohol in provincial liquor stores and providing electricity through local utilities.
Renewal in the public service
All three levels of government scaled back their workforces in the early to mid-1990s to cut budgets and eliminate deficits. However, since 1997 the number of public sector employees has grown by 16% and the private sector labour force has also grown. As such, the proportion of government sector workers among all working Canadians has remained essentially unchanged at 18%.
Delivering essential government services and other programs is expensive work. In 2007, our three levels of government managed budgets totalling $604.5 billion. This spending includes all departments, ministries and government programs, as well as the Canada Pension Plan and Quebec Pension Plan accounts.
How each level of government spends taxpayers’ dollars is partly determined by the constitution. The federal level is responsible for activities that benefit the nation as a whole, such as nationwide social service programs or international relations.
Of the $223.9 billion in federal spending in 2007, about one-third was dedicated to social security payments, family allowances and income assistance. International activities such as national defense, foreign diplomacy and international assistance totalled 10% of federal spending, as did health care and general purpose transfer payments to other levels of government.
The provinces have the main responsibility for health care and education of the $278.4 billon the provinces spent in 2007, more than one-half was devoted to these two areas. Social services account for about one-sixth of provincial spending.
Of the $62.9 billion spent at the local level in 2006, transportation and communication services—such as roads, snow removal and public transit—made up the largest single area of expenditure, absorbing about one-fifth of municipal budgets. Environmental services such as water purification, sewage treatment and garbage disposal were another major item (18% of all spending), as was the protection of people and property—firefighting, policing and the courts (16%).
Spending on priorities
Health and education are the services that have been given priority in recent years. From 2003 to 2007, total government spending on health care jumped 28%, outpacing the 20% growth rate in overall government spending over the same period.
The 23% increase in spending on education also outpaced expenditure growth; spending on postsecondary education jumped 31% from 2003 to 2007. Social services spending rose 20%, keeping pace with overall growth. Other areas saw little growth or even decreases over the same period, such as resource conservation and industrial development, labour, employment and immigration, housing, regional planning and research establishments.
Reducing the debt burden
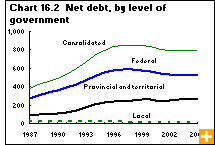
Governments have recently reduced spending in another key area: interest charges on debt. By reducing or eliminating deficits—the shortfalls governments face in a given year—and paying lower interest rates, interest charges as a portion of government expenditures have fallen, from 11% in 2002 to 8% in 2007.
Success in fighting the deficit and debt has not been shared equally by all levels of government. The federal government has posted surpluses every year since 1998. The provinces and territories have seen mixed results, however. Quebec, Ontario, Newfoundland and Labrador, and the three territories have mostly seen deficits, but the commodities boom has helped oil-rich Alberta record sizeable surpluses—$9.5 billion in 2007. Taken together, local governments across Canada have experienced five consecutive years of deficit since 2003.
The 25% overall increase in government spending from 2002 to 2007 has been possible in large part because revenues grew 29% during that period.
Seventy percent of total government income is generated by income taxes, consumption taxes and contributions to social insurance plans. The federal government is most reliant on taxation for revenue, 84% of its income is generated by tax measures. A further 9% is earned through contributions to social insurance plans. The provincial and local levels use taxation less; 57% and 40% of their income, respectively, comes from taxes.
Government income growing
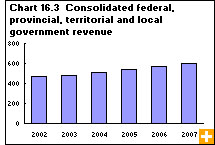
Thanks to robust economic growth over the past decade, government income has seen 29% growth since 2002. With more Canadians working and salaries rising, the total amount of income tax collected jumped 31% from 2002 to 2007 to $246.2 billion. Contributions to government social insurance plans also rose, by 24% to $74.5 billion.
Strong growth in consumer and business spending has pushed income from consumption taxes up 18% to $105.4 billion, although the reduction of the Goods and Services Tax in 2006 has slowed this growth. As well, the booming commodities sector and a steadily rising stock market increased income from government investments by 58% to $51.1 billion.
