
Statistics Canada
www.statcan.gc.ca
Common menu bar links
Income, pensions, spending and wealth

Archived Content
Information identified as archived is provided for reference, research or recordkeeping purposes. It is not subject to the Government of Canada Web Standards and has not been altered or updated since it was archived. Please contact us to request a format other than those available.
Earning money, purchasing a home, a car and other assets, these activities are central to the lives of families. Thanks to economic growth, many Canadians have seen significant economic progress over the last decade. As incomes have grown, spending is near record levels, and family net worth has grown.
Gains for all families
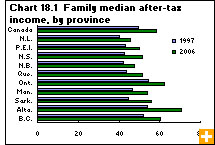
From 1997 to 2006, the median after-tax annual income of families composed of two or more people grew 18%, from $49,400 to $58,300 (2006 constant dollars). This period of sustained growth follows two decades where the median after-tax income for most families grew very little or even declined.
Elderly families, married couples, and two-parent families with children closely reflected the median after-tax overall growth rate of 18% of the past decade. Other families saw bigger growth: the median after-tax incomes of unattached individuals expanded 24% to $22,800 in 2006, with non-elderly women seeing their income grow 36%. Despite this growth, unattached, non-elderly women earned 22% less than unattached, non-elderly men.
Median after-tax incomes for unattached elderly men and women grew the slowest from 1997 to 2006, at 11% and 14% respectively. Lone-parent families saw the most income growth during the past decade: their median after-tax income increased by almost half, from $23,800 in 1997 to $34,900 in 2006.
Incomes follow trends
Incomes across Canada follow regional economic trends, so families in different parts of the country have experienced growth at varying levels since 1997. The western economic boom, particularly since 2003, has helped families in Alberta to pull in 31% more over the last decade. In 2006, Alberta had Canada’s highest median after-tax family income for a third consecutive year. From 2005 to 2006 alone, the median income there grew by $4,600.
After Alberta, Canada’s highest median incomes in 2006 were found in Ontario ($62,400) and British Columbia ($60,300). All other provinces saw median incomes below the national average of $58,300.
Government transfers reduce income inequality
Government transfers can make up a sizeable portion of family income. From 2005 to 2006, unattached individuals and families of two or more people saw their median transfers rise from $3,100 to $3,500.
Child tax benefit programs were changed and new federal and provincial benefits were introduced in 2006, increasing not only the amounts transferred to families, but also the proportion of families receiving transfers. In 2006, 7.9 million families (88% of all Canadian families) and 3.8 million unattached individuals (83%) received government transfers.
While government transfer programs help to reduce income inequality, 633,000 families, or 7% of all families, remained below the low income cut-off after taxes in 2006. This proportion was unchanged from 2005.
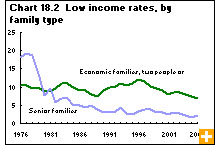
In the late 1970s, Canada’s seniors were the most likely families to experience low income, with nearly 20% earning less than the low income cut-off. Pension program reforms at the end of the 1970s helped this rate to decline sharply, so that by 2006 senior families had Canada’s lowest incidence of low income, at 2.3%.
Female lone-parent families have historically recorded high incidences of low income. But this has been reduced considerably: from a peak of 53% in 1996, the low-income rate for single mothers stood at 28% in 2006.
Taxes take most of the budget
Income brings income taxes. Taxes remained the single largest share of Canadians’ household budgets in 2006. Across all types of households nationwide, families paid an average of $13,634 in taxes, accounting for about 20% of all household expenditures. Taxes were followed closely by shelter costs at 19% and transportation at 14%. Spending on shelter increased from 2005 to 2006 by 5%, to an average of $12,986, largely as a result of the hot housing market out West. Renters also saw their costs increase over the year, by about 10%. Canadian families spent 4% more getting to and from work or around town, to an average of $9,240.
Higher shelter and transportation spending has not stopped Canadians from opening their wallets on other items. With incomes up and the economy booming, households have been spending significantly more on wireless communications, clothing, household furnishings and equipment.
How Canadians spend can depend in large part on their financial situation. The one-fifth of households with the highest incomes, for example, spent 28% of their budget on food, shelter and clothing in 2006, and 29% on personal income taxes. By contrast, the one-fifth of households with the lowest incomes spent 50% of their budget on food, shelter and clothing, with taxes claiming 3%.
Record contributions to retirement savings plans
Canadians did not spend all their earnings at the mall in 2006. They also set money aside for the future by investing in shares and financial programs. The number of people reporting investment income increased for a third straight year in 2006, to 8.2 million. The year was profitable for investors: the total amount earned from their investments grew 16%, reaching $40.9 billion.
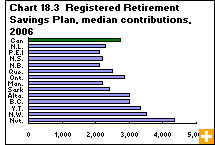
Registered Retirement Savings Plans were also popular in 2006: 6.2 million Canadians made contributions totalling $32.4 billion—the highest amount ever reported. The median contribution nationwide was $2,730.
Albertans took advantage of their larger incomes in 2006 and made the largest median contribution among the provinces, at $3,010. Historically, Canadians in the three territories have put much more into retirement savings plans; in 2006 in Nunavut, the median contribution was $4,350.
About 5.8 million people were also members of employer-sponsored Registered Pension Plans (RPPs), which added 77,700 new members in 2006. Contributions to RPPs climbed 17% to a record high of $43.8 billion. Employers accounted for 72% of total contributions. Although RPPs add members every year, they have grown more slowly than the number of paid workers, so the proportion of paid workers with an RPP has been declining.
With incomes, spending and savings on the rise over the past few years—not to mention rising home values—the net worth of Canadian families has been climbing steadily. The median net worth of all families rose from $120,500 in 1999 to $148,400 in 2005.
