
Statistics Canada
www.statcan.gc.ca
Common menu bar links
Chart 18.4 - Enlarged version and data source

Archived Content
Information identified as archived is provided for reference, research or recordkeeping purposes. It is not subject to the Government of Canada Web Standards and has not been altered or updated since it was archived. Please contact us to request a format other than those available.
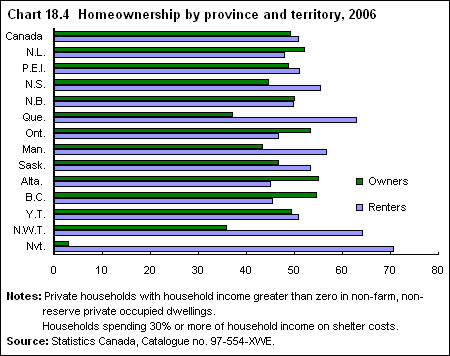
| Renters | Owners | |
|---|---|---|
| % | ||
| Canada | 50.9 | 49.1 |
| N.L. | 48.0 | 52.0 |
| P.E.I. | 51.1 | 48.8 |
| N.S. | 55.5 | 44.5 |
| N.B. | 49.8 | 50.1 |
| Que. | 63.0 | 37.0 |
| Ont. | 46.6 | 53.4 |
| Man. | 56.6 | 43.4 |
| Sask. | 53.3 | 46.7 |
| Alta. | 45.0 | 55.0 |
| B.C. | 45.5 | 54.5 |
| Y.T. | 50.9 | 49.3 |
| N.W.T. | 64.1 | 35.9 |
| Nvt. | 70.7 | 3.0 |
| Notes: Private households with household income greater than zero in non-farm, non-reserve private occupied dwellings. | ||
| Households spending 30% or more of household income on shelter costs. | ||
| Source: Statistics Canada, Catalogue no. 97-554-XWE. | ||
