
Statistics Canada
www.statcan.gc.ca
Common menu bar links
Prices and price indexes

Archived Content
Information identified as archived is provided for reference, research or recordkeeping purposes. It is not subject to the Government of Canada Web Standards and has not been altered or updated since it was archived. Please contact us to request a format other than those available.
Whether it is the price that a farmer pays for inputs such as seed and fertilizer, the price a manufacturer pays for essential raw materials or the price a consumer pays for a good or service, prices affect everyone in an economy.
Rising prices for raw materials and inputs into production generally lead to higher prices for final products and services. This erodes the purchasing power of money over time.
Statistics Canada produces several key price indexes, which are closely monitored by consumers, businesses and governments.
The Consumer Price Index (CPI) is the main economic indicator used to measure inflation. It is consulted by those establishing and evaluating economic policies and setting wage increases. The CPI is also used by economists to deflate current dollar estimates—to remove the effects of price changes over time.
The CPI measures price changes of a fixed ‘shopping basket’ of consumer goods and services that a typical household would purchase. The basket contains over 600 items: on average more than 70,000 price quotes are collected each month to compute the CPI.
Mortgage interest costs and gasoline prices climb
Consumer prices advanced 2.2% in 2007, up from 2.0% in 2006. Owned accommodation and gasoline prices continued to drive up consumer prices in 2007. Owned accommodation is mainly made up of mortgage interest cost and replacement cost—the worn-out structural portion of housing—and is estimated using new housing prices and property taxes. Partly offsetting these increases were lower prices for computer equipment and supplies, the purchase and leasing of passenger vehicles, and natural gas.
Core index surpasses central bank’s target
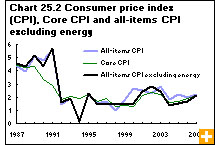
The core index is a special aggregate of the CPI. It is computed by removing the eight most volatile components, and the effect of changes in indirect taxes, from the CPI. These components are fruit, fruit preparations and nuts; vegetables and vegetable preparations; mortgage interest cost; natural gas; heating oil and other fuels; gasoline; intercity transportation; and tobacco products and smokers’ supplies. The core index is used by the Bank of Canada as an instrument to conduct monetary policy: the Bank’s stated aim is to keep overall inflation at 2.0%.
During the first eight months of 2007, the core index advanced an average 2.3% compared with the same months of 2006. For the last four months of the year, however, the average year-over-year core index eased to a 1.7% rate of growth.
To moderate the rise in the core index during the first eight months of the year, the Bank of Canada increased its key ‘overnight rate’ by one-quarter of a percentage point in July. In December, the Bank reversed the increase when the core index showed signs of easing. Over the course of 2007, the core index advanced 2.1%—slightly above the Bank’s operating target and the 1.9% growth rate posted in 2006. Similarly, the CPI excluding energy (gasoline, natural gas, fuel oil and other fuels, and electricity) advanced 2.1% in 2007, up from 1.7% recorded a year earlier.
Western provinces fuel growth in new housing prices
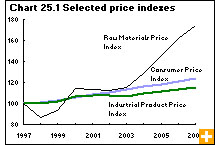
In 2007, Canada’s major housing markets turned in strong performances for the sixth consecutive year. According to the New Housing Price Index (NHPI), new housing prices rose 7.7% in 2007, after rising an average 5.8% over the previous five years.
Although gains were posted in most major regions of Canada, new housing prices climbed most sharply in commodity-rich western regions: Saskatoon, 38.8%; Edmonton, 32.1%; Regina, 22.2%; Calgary, 16.2%; and Winnipeg, 11.8%. Windsor (-2.1%) was the only region to see declining new housing prices in 2007.
The NHPI measures changes over time in the contractors’ selling prices of new residential houses in 21 metropolitan areas.
Commodity price gains continue
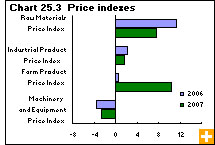
Commodity prices continued to boost the Industrial Product Price Index (IPPI) in 2007. This index kept rising despite a U.S. economic slowdown, which was due directly or indirectly to the meltdown in the U.S. subprime mortgage market. The IPPI is both a measure of the economic performance of Canada’s manufacturing sector and another measure of inflation. It reflects the prices that producers receive for goods sold at the factory gate, rather than the prices consumers pay. Manufacturers received an average 1.6% more for their products in 2007 than in 2006, largely the result of higher prices for primary metal products.
Emerging Asia continues to drive up raw material prices
Canadian firms have been grappling with higher prices for their raw material inputs. These higher costs, however, have not been fully reflected in retail prices, thanks in part to the appreciation of the Canadian dollar. The Raw Materials Price Index (RMPI) measures price changes for raw materials that industries in Canada buy for further processing: this index advanced 7.7% in 2007—well short of the 11.3% rise seen in 2006, and its lowest gain since 2003. The rise in raw material prices was largely attributable to non-ferrous metals. After rising 63.5% in 2006, the price of non-ferrous metals advanced another 23.5% in 2007, a sign that Asian demand is levelling off but still greatly affecting commodity prices.
The RMPI includes all costs a purchaser incurs to bring the commodity to the plant, including transportation, net taxes paid, customs and duties, and the effects of subsidies.
Price declines for imported machinery and equipment
Prices for imported machinery and equipment fell 4.0% in 2007. This decline was partly the result of the appreciating Canadian dollar against the American. Prices for domestically produced machinery and equipment slipped 0.1%. The overall Machinery and Equipment Price Index fell 2.5% in 2007, continuing a trend that began in 2003.
Growing importance for measuring changes in prices of service industries
In 2007, Canadian businesses paid 4.6% more for courier and messenger services as measured by the Couriers and Messengers Services Price Index, down from 7.8% in 2006. This index measures price changes for courier and messenger services provided by long-and short-distance delivery companies to Canadian-based business clients.
As service industries become increasingly important in the economy, Statistics Canada is developing new service price indexes that cover, for example, wholesaling and retailing margins, truck transportation and non-residential rent.
