
Statistics Canada
www.statcan.gc.ca
Common menu bar links
Families, households and housing

Archived Content
Information identified as archived is provided for reference, research or recordkeeping purposes. It is not subject to the Government of Canada Web Standards and has not been altered or updated since it was archived. Please contact us to request a format other than those available.
In 2006, 84% of Canada’s population lived in a census family, that is, a household comprised either of a married or a common-law couple and with or without children, or a household comprised of a lone parent and at least one child in the home. This proportion has remained relatively stable over the last two decades, but the family portrait has evolved: the structure of Canada’s families is more varied today than in the past.
The proportion of census families made up of a couple with children under age 25 and living at home has declined over the last 20 years: in 2006, census families comprised of a couple without children at home slightly outnumbered those with children at home. Also, more and more couples are choosing common-law relationships over marriage, and an increasing number of parents are raising children alone, either by choice or as the result of a broken relationship. Households in which a person lived alone represented a growing share of the population, but they remained a minority.
Same-sex marriage was legalized across Canada in July 2005 and appeared for the first time on the 2006 census form. The census enumerated 7,500 same-sex married couples, a number that is relatively low compared with the total census count of 45,300 same-sex couples.
Fewer families with children
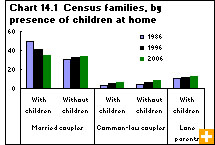
The 2006 Census was the first time that census families comprised of couples without children outnumbered those with children. Couples without children under 25 living at home accounted for 43% of census families in 2006; couples with children accounted for 41% of census families.
The proportion of Canada’s census families comprised of a couple with children has been declining for two decades. In 1986, 52% of census families were couples with children, whereas 35% were couples without children.
From 1986 to 2006, the proportion of married couples with children declined from 49% in 1986 to 35% in 2006. However, the proportion of married couples without children rose from 31% to 34%.
During the same period, the proportion of common-law couples who had children more than doubled their share, from 3% to 7%, while the proportion of common-law couples without children at home increased from 5% to 9%.
The declining number of couples with children can be attributed to the aging baby boomer population, whose children have for the most part grown and moved out of their parents’ home. The decrease is also linked to the fact that baby busters—the generation following the baby boomers—are fewer in number and have lower fertility rates than earlier generations.
The number of children per family has also dropped. The proportion of census families with one child under age 25 at home increased slightly, from 37% in 2001 to 38% in 2006. In contrast, the proportion of families with three or more children slipped from 20% in 2001 to 19% in 2006. Lower fertility rates may help explain this trend.
Fewer married couples
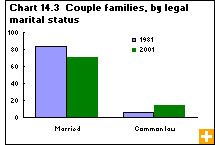
Although most Canadian couples choose marriage, the proportion of married-couple families declined from 2001 to 2006.
Married-couple families accounted for 69% of all census families in 2006, down from 71% five years earlier. During the same period, the proportion of common-law-couple families rose from 14% to 16%, and the share of lone-parent families increased from 15.7% to 15.9%.
Two decades ago, common-law-couple families accounted for 7% of all census families, while married-couple families accounted for 80% and lone-parent families, 13%.
Lone-parent families: more women, more never-married and fewer widowed
Eighty percent of the 1.4 million lone-parent families enumerated in 2006 were headed by women. For the past two decades, lone-parent families headed by women have outnumbered those headed by men by about four to one.
However, families headed by men have been growing at a faster pace. From 2001 to 2006, the number of lone-father families increased more than twice as fast as the number of lone-mother families. One explanation for the faster gain among lone-parent families headed by men is that fewer mothers are granted sole custody following a divorce.
In 2006, there were more never-married lone parents and fewer widowed lone parents compared with 55 years earlier. In 2006, 30% of lone parents had never been legally married and 19% were widowed. In 1951, 2% had never been legally married and 67% were widowed.
Nearly 30% of lone parents were divorced in 2006, a decline from the 1996 historic peak of 34%. In 1951, 3% of lone parents were divorced. Changes to the Divorce Act in 1968 and 1986—the former broadened the grounds for divorce, and the latter reduced the minimum separation required—contributed to the rising number of divorced lone parents.
Household size declining
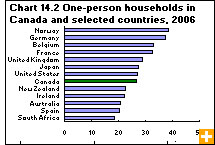
Throughout the 20th century and into the 21st century, the proportion of large households has decreased, and that of smaller households has increased. In 2006, there were three times as many one-person households as households with five or more people. Of the 12.4 million private households, 27% were one-person households, while 9% were large households of five or more people.
In 1941, 6% of households were comprised of one person, while 38% were comprised of five or more people. The proportion of one-person households surpassed that of large households in 1981.
Household size has declined as people either have fewer children or have no children living at home. Smaller households may also be the product of higher rates of divorce and separation.
