
Statistics Canada
www.statcan.gc.ca
Common menu bar links
Transportation

Archived Content
Information identified as archived is provided for reference, research or recordkeeping purposes. It is not subject to the Government of Canada Web Standards and has not been altered or updated since it was archived. Please contact us to request a format other than those available.
In Canada, railways, trucks, ships and airplanes transport everything from food to automobiles, and serve almost every segment of the economy: consumers, retailers, wholesalers, manufacturers, importers and exporters.
The system has more kilometres of road per person than almost any other nation, and also includes 1,111 airports, 72,245 km of operating railroad tracks, and more than 300 commercial ports and harbours.
The transportation sector continues to be a strong economic force in the marketplace, and service demand remains strong. In 2006, transportation contributed $55.5 billion, or about 5%, of Canada’s gross domestic product (GDP), a slight increase over 2005.
Growth in the sector has been consistent since 2004: 3.2% growth in 2006 followed a 3.5% increase in 2005 and a 3.4% increase in 2004.
Trucking is the sector’s largest contributor to GDP: 27% in 2006 came from trucking, about the same as in 2005. Air, water and rail combined contributed another 21% in 2006.
Employment in the transportation sector posted an overall increase of 1% in 2005 compared with 2004, but not every category saw growth. The transportation industry in 2005 employed 547,000 persons, or 4% of Canada’s workforce.
The sector’s strong showing in 2005 contrasted with slow growth from 2001 to 2003. Slower economic growth throughout the Canadian economy, the September 11, 2001 attacks in the United States, the outbreak of SARS (Severe Acute Respiratory Syndrome), and the start of the war in Iraq in 2003 all hurt the transportation sector. Recovery began in 2004 and 2005, thanks to a strong economy that boosted trucking, rail and air traffic.
Roads
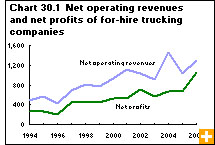
Trucking generated $15.1 billion in 2006. While it continued to be the largest contributor to the transportation sector’s GDP, trucking growth slowed in 2006 to 3%, following a 4% increase in 2005.
Canada’s 3,700 for-hire trucking companies that posted annual earnings of at least $1 million improved their financial performance in 2006. Net operating revenues jumped 26% from 2005, to $1.3 billion.
Thanks to trade agreements like NAFTA, Canada’s trade with the United States rose 191% from 1990 to 2005. For the for-hire trucking industry, this has meant an ever-increasing demand for freight movement across the border. On a tonne-kilometre basis, cross-border truck traffic grew five times faster than domestic traffic from 1990 to 2003.
Commuters driving personal vehicles continue to jam Canada’s roads each weekday. Of 16 million people in the employed labour force, the great majority commute to work. However, growth in the number of workers driving to work was lower from 2001 to 2006 than from 1996 to 2001.
Railroads
The railway industry continued its strong performance in 2006. Among the factors contributing to the gain in operating revenues were a favourable economic climate, rising freight rates and higher fuel surcharges stemming from higher prices for crude oil.
Total operating revenues for the Canadian railway industry rose for an eighth consecutive year, reaching $10.4 billion in 2006. Net operating income rose 13% over 2005 to $2.6 billion.
In 2006, the volume of commodities transported within, into and out of Canada rose 1% over 2005, for a total of 282.8 million metric tonnes. Coal continued to be the main commodity by volume, followed by mixed loads or unidentified freight, then wheat. These three categories accounted for 28% of total tonnage in 2006.
Ports
Canadian ports handled 470.1 million metric tonnes of cargo in 2005, up 4% from the previous record set in 2004. Growth in the international sector was primarily responsible for the increase.
In 2005, 111 for-hire marine carriers earned $231 million in income, as revenues rose 10% over 2004, to $2.9 billion. Government marine carriers posted $828 million in revenues in 2005.
Domestic cargo remained stable in 2005. Gains occurred in shipments of logs and other wood; in stone, sand, gravel and crushed stone; in other metallic ores and concentrates; in gasoline and aviation turbine fuel; and in newsprint. However, these gains were offset by losses in iron ores and concentrates, fuel oils and coal.
Ports and marine terminals under the jurisdiction of 19 Canadian port authorities handled 53% of the total cargo, up slightly from their share in 2004. Activity at these port authorities increased 5.2% in 2005, a faster pace than the growth rate of 4.5% in 2004.
International container traffic at Canadian ports hit another high during 2005. Ports handled more than 3.8 million twenty-foot equivalents containing 31.9 million tonnes of cargo in 2005. However, the growth rate for both volume and tonnage of containerized cargo slipped from 2004.
Air traffic
Following an 11% gain in 2005, the air transport industry’s GDP grew 10% in 2006, and generated nearly $4.9 billion. This represents a five-year high.
In 2006, Canadian air carriers (Levels I to III) reported increase over 2005, to 3.8 million enplaned passengers, and passenger–kilometres rose by 11 billion (10%). These carriers also reported an increase of $1.3 billion (9%) in total operating revenues over 2005.
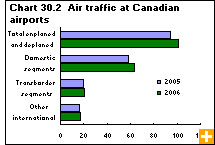
In 2006, air traffic at Canadian airports continued an upward trend begun in 2003, with the total number of enplaned/deplaned passengers (passengers either embarking and taking off, or landing and disembarking, from an airport in Canada) surpassing the 100‑million mark for the first time. The number of passengers (101.0 million) increased 7% compared with 2005 (94.6 million).
The 42 Canadian airports with NAV CANADA air traffic control towers reported 4.9 million aircraft take-offs and landings in 2007, up 8% compared to 2006 (4.5 million). This marks the second consecutive annual increase in total aircraft movements.
