
Statistics Canada
www.statcan.gc.ca
Common menu bar links
Agriculture

Archived Content
Information identified as archived is provided for reference, research or recordkeeping purposes. It is not subject to the Government of Canada Web Standards and has not been altered or updated since it was archived. Please contact us to request a format other than those available.
Canada’s farm population is continuing its long-term decline and those minding the farm tend to be older.
In 2006, the farm population was 684,260: 1 in 46 Canadians now lives on a farm, compared with nearly 1 in 3 in 1931.
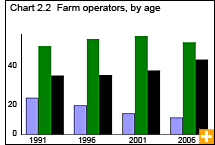
Canada had 327,055 farm operators in 2006, down nearly 6% from 2001. Farms may have more than one operator. In 2006, nearly 41% of these farm operators were aged 55 and older; among the self-employed labour force as a whole, 29% were 55 and older. At 51.0 years, farmers and farm managers had the highest median age of all occupations in the country. In comparison, the median age for the labour force was 41.2 years.
More operators are working off the farm: in 2006, just over 46% reported that their main occupation was something other than agriculture. The top off-farm occupation for male farm operators was running transportation equipment. For female farm operators, clerical occupations predominated.
Revenue measures industry’s health
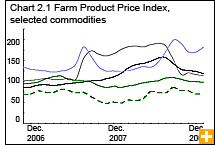
Canadian farmers generated $41.8 billion from the sale of crops and livestock in 2008, 14% more than in 2007. Receipts for crop producers totalled $23.0 billion in 2008, up nearly 26% from 2007 as a result of higher prices, driven by tight world supplies and strong demand. Revenue from Canada’s two main cash crops rose in 2008.
Receipts from wheat (including durum, the wheat used for pasta) were up 49%; receipts from canola, 42%. Stronger grain and oilseed prices, particularly in the first three quarters of 2008, were the main factor behind these gains.
In the crop sector, while grain and oilseed prices climbed, so did the cost of their inputs. Fertilizer prices rose 60% and diesel fuel prices rose 37% during the first 11 months of 2008 compared with the same period in 2007.
Livestock receipts in 2008 rose nearly 3% to $18.8 billion. Revenue from cattle and calves gained almost 3%: prices fell nearly 1%, but a record number of cattle were marketed.
Receipts from cattle and calf exports rose nearly 6% from 2007.
Both receipts and volumes rose for milk, poultry and eggs: this supply-managed sector posted a 6% increase in receipts. These commodities together accounted for 44% of total livestock receipts.
In the hog industry, receipts fell 3%, shipments, 1%, and prices, 2%.
Across the livestock sector, higher grain prices pushed up feed costs for much of the year, and profits were also hurt by a strong Canadian dollar.
The number of cattle and hogs on farms declined in 2008. Hog inventories were down more than 10% to 12.2 million, continuing a three-year decline. The number of cattle—beef and dairy—dropped 5% to 13.2 million head as of January 1, 2009.
