
Statistics Canada
www.statcan.gc.ca
Common menu bar links
Chart 19.2 - Enlarged version and data source

Archived Content
Information identified as archived is provided for reference, research or recordkeeping purposes. It is not subject to the Government of Canada Web Standards and has not been altered or updated since it was archived. Please contact us to request a format other than those available.
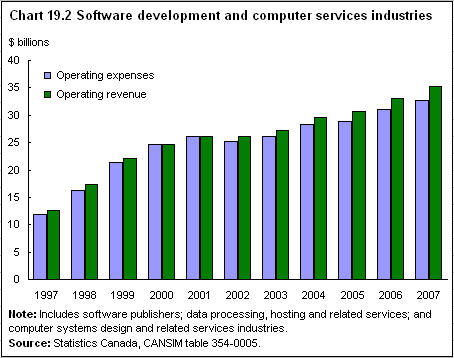
| Operating revenue | Operating expenses | |
|---|---|---|
| $ millions | ||
| 1997 | 12,682 | 11,922 |
| 1998 | 17,371 | 16,251 |
| 1999 | 22,167 | 21,434 |
| 2000 | 24,711 | 24,579 |
| 2001 | 26,110 | 26,174 |
| 2002 | 26,180 | 25,120 |
| 2003 | 27,297 | 26,205 |
| 2004 | 29,679 | 28,221 |
| 2005 | 30,741 | 28,806 |
| 2006 | 33,101 | 31,001 |
| 2007 | 35,269 | 32,745 |
| Note: Includes software publishers; data processing, hosting and related services; and computer systems design and related services industries. | ||
| Source: Statistics Canada, CANSIM table 354-0005. | ||
