
Statistics Canada
www.statcan.gc.ca
Common menu bar links
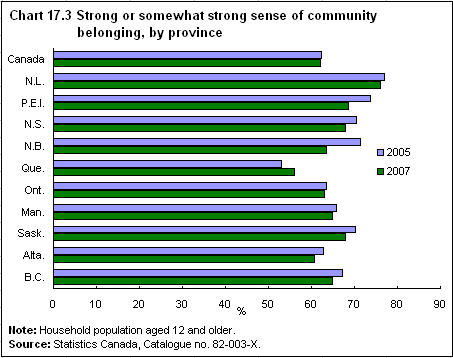
Chart 17.3 - Enlarged version and data source

Archived Content
Information identified as archived is provided for reference, research or recordkeeping purposes. It is not subject to the Government of Canada Web Standards and has not been altered or updated since it was archived. Please contact us to request a format other than those available.
| 2005 | 2007 | |
|---|---|---|
| % | ||
| Canada | 62.3 | 62.0 |
| N.L. | 76.9 | 76.0 |
| P.E.I. | 73.7 | 68.5 |
| N.S. | 70.5 | 68.0 |
| N.B. | 71.4 | 63.5 |
| Que. | 53.0 | 56.1 |
| Ont. | 63.4 | 63.0 |
| Man. | 65.9 | 64.9 |
| Sask. | 70.2 | 67.9 |
| Alta. | 62.8 | 60.7 |
| B.C. | 67.1 | 64.8 |
| Note: Household population aged 12 and older. | ||
| Source: Statistics Canada, Catalogue no. 82-003-X. | ||
