
Statistics Canada
www.statcan.gc.ca
Common menu bar links
Income, pensions, spending and wealth

Archived Content
Information identified as archived is provided for reference, research or recordkeeping purposes. It is not subject to the Government of Canada Web Standards and has not been altered or updated since it was archived. Please contact us to request a format other than those available.
The job market slump and stock market declines eroded wealth in the fourth quarter of 2008, so many Canadians changed their approach to spending and saving as they faced the first recession in 16 years.
Suddenly cautious, Canadian households in the fourth quarter curtailed their net borrowing to its lowest level since 2005. Those who invest repatriated funds to the security of assets in Canada.
Personal disposable income continued to advance in the last three months of 2008 (0.4%), as increases in labour income and government transfers to people more than offset lower investment income. Labour income increased 0.7%, a similar rate to the third quarter, while average weekly earnings were up.
After decelerating since the start of the year, personal spending pulled back in the fourth quarter for the first time since the fourth quarter of 1995. Both goods and services contributed to the 0.8% decline. Spending on services was down 0.4%. This was the first decrease since the second quarter of 2001. Personal spending excluding housing fell 1.2%.
Personal spending declines
Spending on new and used vehicles dropped 5.5% in the fourth quarter of 2008, following declines earlier in the year. Still, with the stimulus of manufacturers’ incentives and a one percentage point reduction in the GST early in the year, spending on motor vehicles increased 3.7% in 2008.
After 15 quarterly advances, spending on furniture, furnishings, and household equipment and maintenance fell 2.3% in the fourth quarter. Purchases of food, beverages and tobacco also fell, as did clothing and footwear purchases.
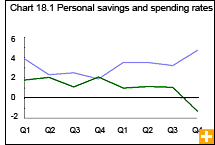
Personal saving increases
The downturn in spending (in nominal terms), combined with the increase in disposable income, led to $45 billion worth of personal saving in the fourth quarter of 2008 alone, $15 billion higher than in the third quarter. This level of personal saving was the highest since the fourth quarter of 1995, and produced a saving rate of 4.7%, the highest rate recorded for Canadians since the first quarter of 2002.
Spending patterns
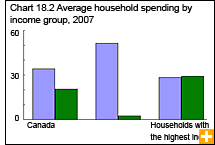
People in the lowest income groups generally spend more of their income to provide the basics for their household. In 2007, the one-fifth of Canadian households with the lowest incomes spent an average of $22,340 on the basics.
More than half (52%) of that total spending went to food, shelter and clothing, whereas personal taxes took 3% of their budget.
By comparison, the one-fifth of households with the highest incomes spent an average of $143,360 in 2007. They spent 28% of that on food, shelter and clothing; 29% of their total spending went to pay personal taxes.
