
Statistics Canada
www.statcan.gc.ca
Common menu bar links
Prices and price indexes

Archived Content
Information identified as archived is provided for reference, research or recordkeeping purposes. It is not subject to the Government of Canada Web Standards and has not been altered or updated since it was archived. Please contact us to request a format other than those available.
Prices are often seen as an indicator of the state of the economy: in 2008, prices for goods and services were as volatile as any other economic indicator. Prices for many key goods and services advanced strongly in the first part of the year, but weakened in the last few months.
The advance was strong enough that prices for the goods and services in the Consumer Price Index (CPI) basket were, despite the late-year drop, an average 2.3% higher in 2008 than in 2007. Prices rose an average of 2.2% in 2007 compared with 2.0% in 2006.
Over the course of 2008, consumer prices posted the most dramatic ups and downs seen since 2003. On a seasonally adjusted monthly basis, consumer prices increased by 0.3% in the first quarter of the year, after rising 0.8% in the final quarter of 2007. In the second quarter of 2008, prices advanced 1.7%; however, in the fourth quarter, they dropped 1.2%.
Shelter, transport and food prices most active
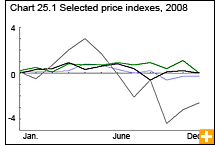
The all-items CPI rose and fell in step with both the shelter and transportation price indexes over the year. Energy prices are a key component of the shelter and transportation indexes, and they influenced food prices.
Fuel oil and natural gas prices helped push up, then pull down, the shelter cost index. However, the cost of owned accommodation was the most significant upward contributor, the result of a strong housing market over most of 2008. Despite its year-end decline, the shelter cost index rose 4.4% over the course of 2008, accounting for about one-half the increase in the all-items CPI.
The transportation cost index, which includes costs for buying, renting and leasing vehicles; operational costs for vehicles such as gasoline, maintenance and repairs and parking fees; and public transportation, both within and between cities, rose 2.0% in 2008. Prices for purchasing passenger vehicles fell 6.9%, the largest annual decline since 1955.
Rising food prices are nothing new: food prices have outpaced growth in the all-items CPI for five consecutive years. The food cost index advanced 3.5% in 2008, reflecting worldwide agricultural supply and demand conditions and higher energy prices.
The rise was mainly the result of surging commodity prices, partly driven by growing demand for food in emerging markets, as well as rising gasoline prices, which pushed up transportation costs.
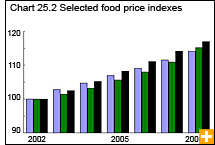
Food purchased from stores, rather than restaurants, has been the primary driver of higher consumer food prices. Prices for restaurant food rose 2.5%. Prices for food purchased from stores advanced for the fifth consecutive year, rising 3.9% in 2008 and 2.7% in 2007.
Prices for food staples such as bread, rice, flour, milk and eggs rose sharply in 2008. Price increases for bakery and cereal products were the greatest contributors, as the surge in prices for grains meant higher costs at the kitchen table. In particular, bread prices rose 15.1%; flour, 34.5%; pasta, 31.9%; and rice, 17.4%.
