
Statistics Canada
www.statcan.gc.ca
Common menu bar links
(Note: Content area on this page may be wider than usual.)
Map 15.2 - Enlarged version

Archived Content
Information identified as archived is provided for reference, research or recordkeeping purposes. It is not subject to the Government of Canada Web Standards and has not been altered or updated since it was archived. Please contact us to request a format other than those available.
Description for map 15.2
Map of Canada
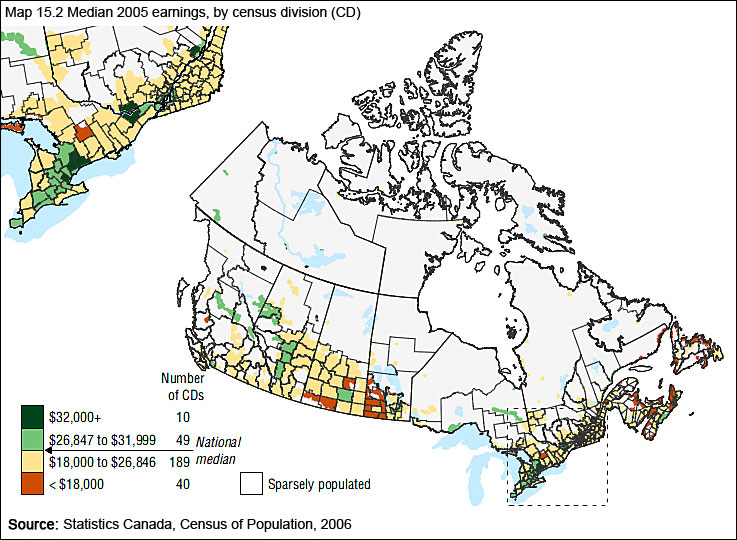
Median earnings of the population in 2005, by census division.
Census divisions in Canada were divided into four groups. The groups are ranked from the highest to the lowest median earnings of the population. The white area on the map represents sparsely populated regions in Canada and is not associated with a value for median earnings.
On this map, dark green and green correspond to census divisions with median earnings higher than $26,846 and yellow and orange correspond to census divisions with median earnings less than $26,847. Group 1 is dark green, group 2 is green, group 3 is yellow, group 4 is orange. The map shows that the national median income was $26,846.50.
The number of census divisions per group is also provided on this map. These numbers are provided in the following table.
Source: Statistics Canada, Census of Population, 2006.
Each census division is coloured according to the following data table:
| Number of census divisions | Group | Colour | |
|---|---|---|---|
| Median earnings | |||
| $32,000 and above | 10 | 1 | Dark Green |
| $26,847 to $31,999 | 49 | 2 | Green |
| $18,000 to $26,846 | 189 | 3 | Yellow |
| Less than $18,000 | 40 | 4 | Orange |
