
Statistics Canada
www.statcan.gc.ca
Common menu bar links
(Note: Content area on this page may be wider than usual.)
Map 15.4 - Enlarged version

Archived Content
Information identified as archived is provided for reference, research or recordkeeping purposes. It is not subject to the Government of Canada Web Standards and has not been altered or updated since it was archived. Please contact us to request a format other than those available.
Description for map 15.4
Map of Canada
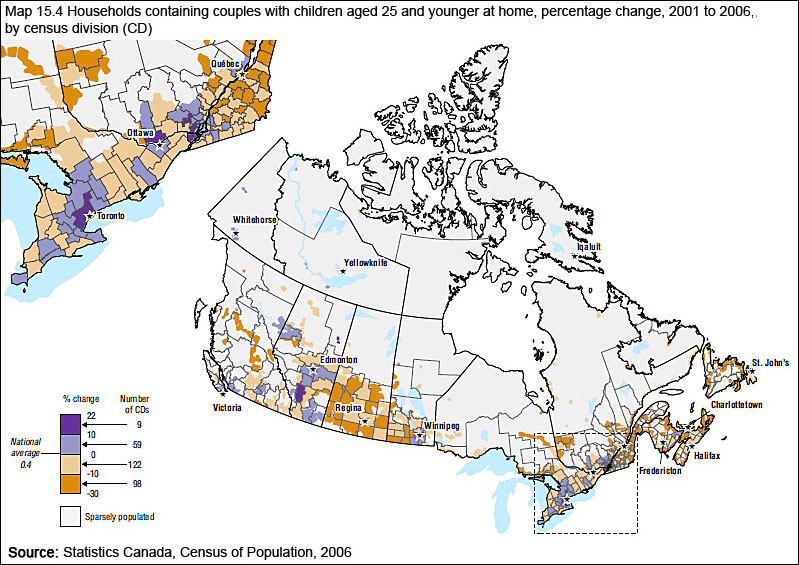
Percentage change in the number of households containing couples with children aged 25 and younger at home, by census division, 2001 to 2006.
Census divisions were divided into four groups. The groups are ranked from the lowest to the highest percentage change in the number of households containing couples with children aged 25 and younger at home. The white area on the map represents sparsely populated regions in Canada and is not associated with a percentage change.
On this map, the shades of purple correspond to census divisions with a positive percentage change and the shades of orange correspond to census divisions with negative percentage change. Group 1 is purple, group 2 is light purple, group 3 is light orange, and group 4 is orange.
The national average percentage change in the number of households containing couples with children aged 25 and younger at home is also provided on this map. It is included at the beginning of the following table, followed by the number of census divisions per group.
The national average percentage change in the number of households containing couples with children aged 25 and younger at home is 0.4% .
Source: Statistics Canada, Census of Population, 2006.
Each census division is coloured according to the following data table:
| Number of census divisions | Group | Colour | |
|---|---|---|---|
| Percentage change in the number of households containing couples with children aged 25 and younger at home | |||
| 10% to 22% | 9 | 1 | Purple |
| 0% to 10% | 59 | 2 | Light purple |
| -10% to 0% | 122 | 3 | Light orange |
| -30% to -10% | 98 | 4 | Orange |
