
Education, training and learning

Archived Content
Information identified as archived is provided for reference, research or recordkeeping purposes. It is not subject to the Government of Canada Web Standards and has not been altered or updated since it was archived. Please "contact us" to request a format other than those available.
Related information
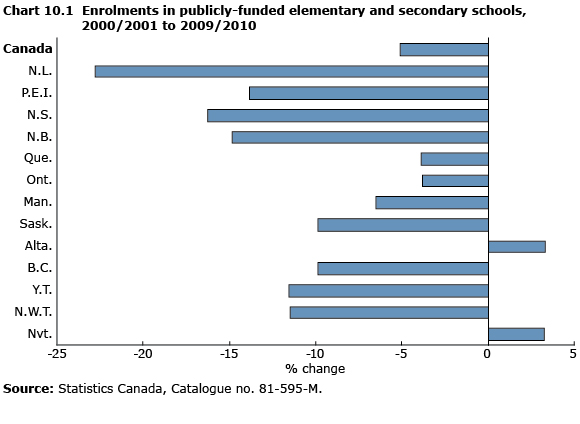
In the 2009/2010 school year, enrolment in Canada's publicly funded elementary and secondary schools was just under 5.1 million students, down 5% from 2000/2001.
This downward trend in enrolment was seen across Canada, with only Alberta having increased enrolment, up 3%. Newfoundland and Labrador had the largest enrolment decrease, 23%, followed by decreases of 16% in Nova Scotia, 15% in New Brunswick and 14% in Prince Edward Island.
The percentage of the population who complete secondary school is rising. In 2009, 92% of Canadian adults aged 25 to 34 had completed secondary school, compared with 80% of those aged 55 to 64. The proportion of adults aged 25 to 64 who have completed secondary school increased from 80% in 1999 to 88% in 2009.
Canada's 2009 secondary school completion rate is the fifth-highest rate among the countries that belong to the Organisation for Economic Co-operation and Development. Canada ties for fifth with Poland, behind the Czech Republic and the Slovak Republic (91% each) and Estonia and the United States (89% each).
In 2009, about half of the population aged 25 to 64 had completed either college or university (49%). An additional 12% had completed other postsecondary education such as apprenticeship training or certificates or diplomas from vocational schools.
Investing in education
Postsecondary education can be an expensive investment, especially at the university level. Canadian full-time students in undergraduate programs paid an average of $5,366 in tuition fees for the 2011/2012 academic year, up 4.3% from a year earlier. Tuition fees paid by graduate students rose to an average of $5,599, up 3.7%. In comparison, inflation as measured by the Consumer Price Index was 2.7% between July 2010 and July 2011.
Undergraduate tuition fees were lowest in Quebec ($2,519) and Newfoundland and Labrador ($2,649). These provinces also had the lowest graduate tuition fees ($2,731 and $2,456, respectively). By contrast, Ontario had the highest fees for both undergraduate ($6,640) and graduate ($7,578) students.
Nationally, students in dentistry paid the highest average undergraduate tuition fees ($16,024), followed by students in medicine ($11,345) and pharmacy ($9,806). At the graduate level, the most expensive programs were the executive master of business administration (MBA) with tuition fees of $37,501, and the regular MBA program, at $21,528.
While universities are partly government funded, they receive additional funding from private sources, including tuition fees. Private sources supplied 39% of the revenue for Canadian universities in 2008/2009. Fees charged to students, including tuition, made up over half of that portion, at 22% of total revenue.
In 2008/2009, the share of university revenue received from the government varied from 49% in Nova Scotia to 72% in Alberta. While the share of revenue coming from student fees was relatively low in Alberta (15%), the smallest shares were in Newfoundland and Labrador (12%) and Quebec (12%), where undergraduate and graduate tuition fees were lowest.
Many adults take training
From July 2007 to June 2008, nearly 8 million adults aged 25 to 64 participated in formal training activities or education, 85% of whom did so for career- or job-related reasons. Over this period, 45% of workers aged 34 and younger participated in training activities, compared with 29% of those aged 55 to 64. Women were more likely than men to participate (43% versus 39%).
Workers who already have higher education were more likely to participate in formal training activities or education as adults. During this period, 18% of workers who had not completed high school participated, compared with 56% of those who had a university degree.
Rates of participation in job-related training or education are also linked to the size of the employer: 55% of employees working for employers with 500 employees or more participated, 44% of those who worked for employers with between 20 and 500 employees, and 37% for employers with fewer than 20 employees.
Only 30% of self-employed workers participated in training activities, whereas 44% of paid workers did so. Participation rates were highest in health care (62%); social science, education and government services 61%); natural and applied sciences (51%); and management (51%).
- Date modified: