
Precipitation rising across Canada

Archived Content
Information identified as archived is provided for reference, research or recordkeeping purposes. It is not subject to the Government of Canada Web Standards and has not been altered or updated since it was archived. Please "contact us" to request a format other than those available.
Related information
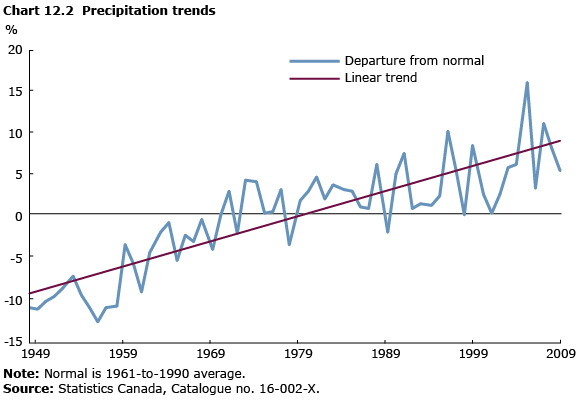
From 1948 to 2009, the annual precipitation trend increased across Canada. Compared to the "normal" precipitation levels from 1961 to 1990, the trend was 8% above the normal in 2009, an increase of 17 percentage points from 1948.
Precipitation increased nationally in all four seasons compared to the normal, with the largest increase in spring (24 percentage points), and the smallest in summer (13 percentage points).
Most of Canada's 11 climatic regions showed increased precipitation compared to the normal, particularly in the northern climatic regions: Arctic Mountains and Fiords (34 percentage points) and Arctic Tundra (36 percentage points). For both regions, the increase was most notable in spring.
The Pacific Coast and the South British Columbia Mountains climatic regions experienced decreased precipitation during winter (-7 and -18 percentage points, respectively), but data show increased precipitation during spring and fall.
- Date modified: