
Ethnic diversity and immigration

Archived Content
Information identified as archived is provided for reference, research or recordkeeping purposes. It is not subject to the Government of Canada Web Standards and has not been altered or updated since it was archived. Please "contact us" to request a format other than those available.
Related information
Canada welcomed 252,172 immigrants in 2009, up 2.0% from 2008 and up 6.5% from 2007. This is 33% higher than the 189,951 who arrived in 1999.
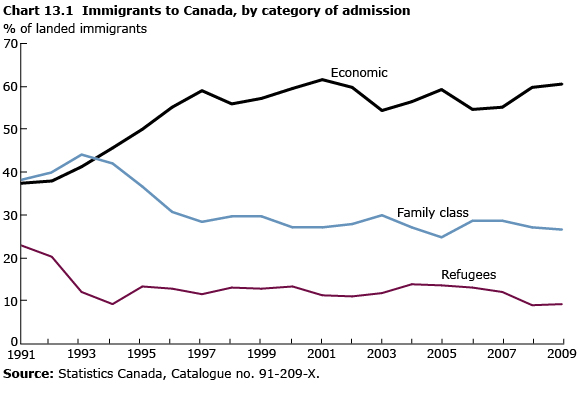
Over the decade, the composition of immigration shifted. Although overall immigrant numbers grew, refugees decreased both as a share of total immigration (from 13% to 9%) and in number (from 24,397 to 22,846). Meanwhile, family reunifications also decreased as a share of total immigration (from 29% to 26%), but increased in number (from 55,274 to 65,206).
By contrast, economic immigration grew markedly since 1999, rising from 109,249 to 153,492 immigrants, an increase of 40%. Economic immigrants represented 6 out of 10 immigrants to Canada in 2009.
Most immigrants still choosing the three biggest provinces
In 2009, 3 out of 4 immigrants settled in Canada's three largest provinces—Ontario, Quebec and British Columbia. Despite their high levels of immigration in 2009, 2 of the 3 provinces received lower shares of new arrivals than in previous years. Most notably, the share of arriving immigrants in Ontario fell to 42% in 2009, down from almost 55% in 1999.
The number of immigrants to British Columbia also declined since the 1990s. While 19% of incoming immigrants settled in British Columbia in 1999, just over 16% did so in 2009.
Immigration to Quebec has been proportionally rising since the late 1990s. In 1999, just over 15% of immigrants settled in Quebec, whereas around 20% did in 2009—the highest proportion since 1991.
Overall, the proportion of immigrants settling in the three biggest provinces fell significantly from the 1990s. In 1999, nearly 90% of incoming immigrants chose Ontario, British Columbia or Quebec as their destination, compared with 78% in 2009.
Just over half of immigrants to Ontario (51%) were admitted under the economic category in 2009, the lowest among the provinces. Larger proportions of immigrants to British Columbia (62%) and Quebec (70%) were in this category.
Atlantic region attracting more immigrants
As the share of immigrants settling in the three biggest provinces has been declining, more and more have been settling in Canada's other regions. In 2009, 2.6% of immigrants landing in Canada chose to make their home in the Atlantic provinces—a relatively low share, but up significantly from 1.4% in 1999.
The annual share of immigrants arriving in Newfoundland and Labrador has remained around 0.2% to 0.4% since 1981. The share choosing Nova Scotia has varied somewhat but stayed close to 1.0%: it was 0.9% in 2009, compared with 0.8% in 1999.
Notable increases occurred in both Prince Edward Island and New Brunswick in the 2000s. In 2009, Prince Edward Island received 0.7% of all immigrants arriving in Canada, up from 0.1% in 1999. In 2009, 0.8% of immigrants settled in New Brunswick, compared with 0.3% in 1999.
As well, both provinces welcomed a much larger share of economic migrants than the national average of 61%. In Prince Edward Island, 91% of immigrants in 2009 were admitted under the economic category. The corresponding figure for New Brunswick was 78%.
Prairies' share of immigrants nearly doubled
The share of immigrants settling in Manitoba, Saskatchewan and Alberta rose from 9% in 1999 to 19% in 2009. Each Prairie province also experienced a significant increase in its share of immigrants. Manitoba received 5.4% of immigrants in 2009 (up from 2.0% in 1999) and Saskatchewan welcomed 2.7% (up from 0.9%), while Alberta was the destination for 10.7% (up from 6.4%).
As in the Atlantic provinces, the composition of immigrants who arrived in the Prairie provinces differed somewhat from the national average, particularly in the two easternmost provinces. The proportion of immigrants admitted under the economic category was 80% in Saskatchewan and nearly 81% in Manitoba, considerably higher than the 61% national average.
In 2009, 16.4% of all immigrants to Canada went to British Columbia, down from 17.8% in 2008. More than three-fifths of immigrants (62.5%) admitted to British Columbia in 2009 entered as economic immigrants while 30.4% entered using the family class. The percentage of refugees (3.9%) was less than half that of Canada overall.
- Date modified: