
Labour

Archived Content
Information identified as archived is provided for reference, research or recordkeeping purposes. It is not subject to the Government of Canada Web Standards and has not been altered or updated since it was archived. Please "contact us" to request a format other than those available.
Related information
In 2011, Canada's labour force was nearly 18.7 million people, up from 18.5 million in 2010. Of these workers, 17.3 million were employed full time or part time and almost 1.4 million were unemployed.
Canada's unemployment rate dropped to 7.4% in 2011, down from a decade high of 8.3% in 2009, and comparable to the 7.2% level in 2004. At the same time, the overall participation rate—the share of the total population aged 15 and older who are working or looking for work—decreased from 67.0% in 2010 to 66.8% in 2011.
Based on projection scenarios, the labour force could grow to between 20.5 and 22.5 million people by 2031. The overall participation rate could fall to between 59.7% and 62.6% by 2031, a level not seen since the 1970s. As the baby boomers retire, the number of people in the labour force for each non-working senior could be 3 or fewer by 2031.
Close to 25% of people in the labour force are projected to be aged 55 and older by 2021, up from 17.5% in 2011. By 2031, nearly 1 in 3 may be foreign-born; 1 in 3 may belong to a visible minority group, compared with less than 16% in 2006.
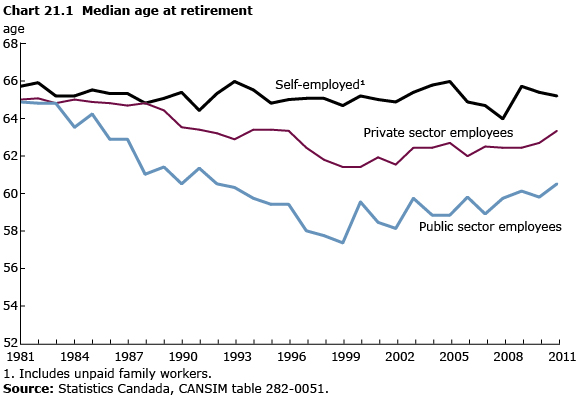
Delayed retirement
In 2008, an employed 50-year-old could expect to work another 16 years. This is 3.5 years longer than workers of the same age in the mid-1990s, who could expect to work 12.5 more years. The 3.5-year increase was the same for both men and women.
The expected length of retirement increased from 1977 to the mid-1990s and has remained relatively stable. From 1977 to 1994, the expected time men would spend in retirement increased from 11.2 to 15.4 years. The trend for women was similar, rising from 16.4 to 20.6 years. In 2008, men were estimated to have 15.0 years of retirement while women would have 19.0 years.
The expected length of retirement has stabilized as the trend of delayed retirement is offset by a similar increase in life expectancy. In 2008, a 50-year-old man could expect to spend 48% of his remaining years of life in retirement, compared with 45% in 1977, while a 50-year-old woman could expect to spend 55% of her remaining years of life in retirement, nearly identical to the proportion in 1977.
Average weekly earnings growing
Average weekly earnings across Canada reached $884 in December 2011, up 1.8% from December 2010. Of Canada's 10 largest industrial sectors, 3 saw an increase in earnings above the national average: construction, up 4.6% to $1,132; retail trade, up 4.4% to $525; and educational services, up 3.3% to $956.
Growth in earnings also surpassed the national average in some smaller sectors. From December 2010 to December 2011, earnings increased in the two highest-paying industries: utilities, up 2.2% to $1,660; and mining, quarrying and oil and gas extraction, up 8.9% to $1,800. Average weekly earnings in health care and social assistance declined 1.2% to $795 in the same period. Earnings in this sector fell for three consecutive months from September 2011 to December 2011, largely driven by earnings declines in hospitals.
Almost every province saw higher average weekly earnings from December 2010 to December 2011, led by Newfoundland and Labrador (up 5.1% to $901). Alberta continued to record the highest level of earnings among the provinces, increasing 4.4% to $1,050. Average weekly earnings were unchanged in Nova Scotia at $779, while Prince Edward Island recorded the lowest earnings among the provinces at $731. The territories all experienced increases well above the national average from December 2010 to December 2011: Nunavut, up 6.4% to $930; the Northwest Territories, up 5.5% to $1,254; and Yukon, up 2.5% to $966.
Income changes and migration
When the employment and wage prospects of one region weaken in relation to others, residents—particularly those active in the labour force—look to migrate elsewhere to improve their economic situation.
The greater the decline in income, the more incentive to migrate. In a study from 1999 to 2008, people whose incomes fell were 82% more likely to leave their region the following year than individuals whose incomes remained stable. People who experienced a 20% decline in income were 49% more likely to migrate than individuals whose incomes remained stable.
Increases in income are also associated with greater likelihood of migration, although the relationship is much weaker than for equivalent decreases in income. For example, people whose incomes rose by 30% or more in two years were 46% more likely to migrate than people whose incomes did not change. Results for men and women were similar.
- Date modified: