
Manufacturing

Archived Content
Information identified as archived is provided for reference, research or recordkeeping purposes. It is not subject to the Government of Canada Web Standards and has not been altered or updated since it was archived. Please "contact us" to request a format other than those available.
Related information
In 2011, the Canadian manufacturing sector continued its recovery from the global economic downturn as sales increased for the second consecutive year.
Manufacturers sold goods worth $571.2 billion in 2011, up 7.8% from 2010, following an 8.9% rise in 2009. However, this was still short of the $592.0 billion sold in 2008, when the downturn began.
Sales rose in 14 of 21 manufacturing sectors in 2011, notably in the six largest industries in the sector: transportation equipment; food; petroleum and coal products; primary metals; chemicals; and machinery. Combined, these accounted for 67.3% of total sales.
Sectors in which sales declined in 2011 included paper manufacturing, wood products, printing and related support activities and furniture and related products.
Manufacturing sales rose in nine provinces in 2011. Gains in central Canada were below the national average. In Ontario, sales rose 6.0% to $257.9 billion, while in Quebec they increased 5.4% to $139.3 billion.
In resource-rich Alberta, manufacturing sales increased 18.1% to $70.9 billion, the biggest increase among the provinces. Prince Edward Island declined 0.6% to $1.2 billion.
Eight sectors surpass pre-recession sales
December 2011 sales, at $50.0 billion, were just short of the pre-downturn total of $50.2 billion in October 2008. As of December 2011, monthly sales for 8 of 21 manufacturing industries had reached or surpassed levels recorded in October 2008, the onset of the downturn.
Plastics and rubber products manufacturing, machinery, miscellaneous manufacturing, transportation equipment, food, leather and allied products, petroleum and coal products, and beverage and tobacco products grew over the period.
Unfilled orders increase
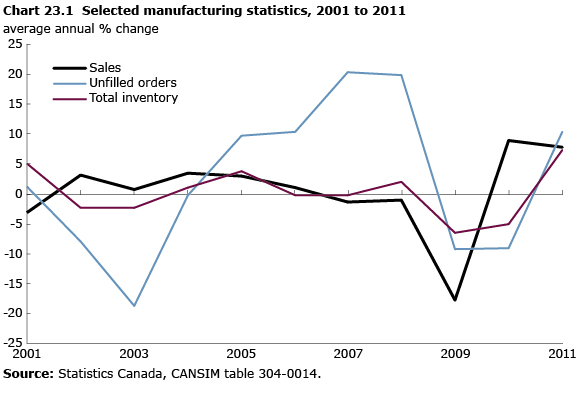
Unfilled orders rose 10.4% to $58.0 billion in 2011, the first increase since 2008.
Fabricated metal products unfilled orders rose 25.5% to $5.8 billion in 2011 after declines in the previous two years. Primary metal manufacturing increased 17.4% to $1.5 billion in 2011 and transportation equipment rose 14.4% in 2011 to $35.2 billion.
In 2011, non-metallic mineral product manufacturing fell 19.8% to $256 million and printing and related support activities fell 16.1% to $101 million. Wood product manufacturing fell by 14.4% to $273 million.
Inventory levels rise
Inventories rose 7.3% to $63.2 billion in 2011, the first annual average increase since 2008. Inventories were up in 18 of 21 industries. Primary metal manufacturing had the biggest increase, 16.9%, to reach $7.7 billion. In petroleum and coal products, inventories rose 15.5% to $4.8 billion and the value of finished products on hand was up 16.3% to $2.2 billion.
Inventory levels in the computer and electronic products industry advanced 13.9% to $2.8 billion. Higher inventories of raw materials were responsible for most of the gain.
In the machinery industry, inventories increased 8.7% to $6.3 billion in 2011. Manufacturers reported higher inventories for all three stages of fabrication: raw materials, goods in process and finished products inventories.
The only declines occurred in printing and related support activities (2.2%), beverage and tobacco product manufacturing (2.1%) and paper manufacturing (0.5%).
The inventory-to-sales ratio remained steady at 1.33 in 2011. The inventory-to-sales ratio is a measure of the time, in months, that would be required to exhaust inventories if sales were to remain at their current level.
Capacity use up in 15 industries
Manufacturers operated at 79.0% of capacity in 2011, up from 77.1% in 2010. This rate was still below the 82.8% in 2007.
The capacity utilization rate is a measure of how much manufacturers produced compared with what they could produce if they were to use all their resources.
The rate rose in 15 major manufacturing industries and fell in five industries. Among the industries reporting increases, the machinery industry (9.1%) and fabricated metal products (5.6%) grew the most. Higher production of agricultural, construction, and mining and oil and gas field machinery drove up the capacity use rate in the machinery industry to 78.2%, up from 71.7% in 2010.
Capacity use in the transportation equipment industry was 82.4% in 2011, an increase from 66.7% in 2009. This growth was mainly the result of an increase in motor and aerospace vehicle and parts manufacturing.
Capacity use declined in some industries, particularly the petroleum and coal products industries (5.1%) and, to a lesser extent, in beverage and tobacco products (1.4%), furniture and related products (1.4%), clothing industries (1.2%) and wood products (0.5%).
- Date modified: