
Income, pensions, spending and wealth

Archived Content
Information identified as archived is provided for reference, research or recordkeeping purposes. It is not subject to the Government of Canada Web Standards and has not been altered or updated since it was archived. Please "contact us" to request a format other than those available.
Related information
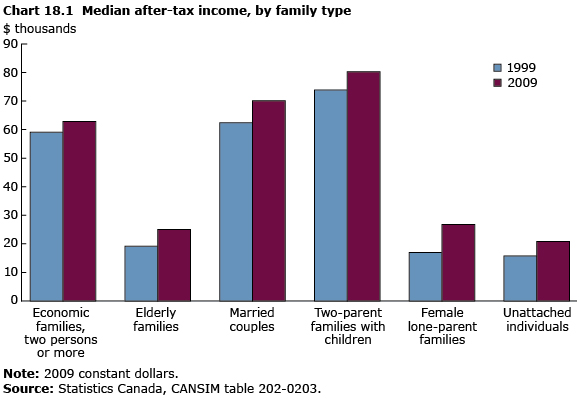
Median after-tax income for Canadian families of two or more people amounted to $63,800 in 2009, virtually unchanged from 2008. This was the second consecutive year without significant change following four years of growth.
After-tax income is the total of market income and government transfers, less income tax. Median market income and income tax declined for most family types from 2008 to 2009, whereas median transfers from governments to families increased by 1,400 to $6,200 (in 2009 constant dollars).
In Saskatchewan, median after-tax income of families of two or more people rose 7.5% to $69,900; in New Brunswick, the median increased 3.2% to $55,000.
The highest median after-tax income for this group has been in Alberta since 2004, continuing the trend at $77,800 in 2009. Median after-tax income for families of two or more people remained stable in the other provinces.
For unattached individuals, after-tax income also remained stable in 2009, at $25,500. But this was not the case for all unattached individuals. Unattached seniors' median after-tax income rose 4.5% to $23,300.
Families living in Regina, Calgary, Edmonton, Hamilton and Victoria all reported median after-tax income above the national median of $63,800.
Family income has decreased
Market income—the sum of earnings from employment, investment income and private retirement income—decreased from 2008 to 2009. Families with two or more persons saw their median market income decrease by 3.2% to $63,000, the first drop since the early 1990s.
For working-age individuals (aged 25 to 54) who received market income, the median amount decreased 2.4% to $37,200 in 2009.
For working-age individuals in particular, market income is tied to their unemployment rate. From 2008 to 2009, their unemployment rate rose by 2.0 percentage points to 7.1%. This rate was similar to the increase in the unemployment rate during the 1990–1991 recession, but lower than the 2.9-percentage-point increase of the 1981–1982 recession. In the 2008–2009 recession, working-age individuals' decrease in market income was less than during the two previous recessions.
Government transfers to families
Transfers received by different family types vary widely. In 2009, median government transfers to non-senior families amounted to $3,600; for senior families, the median was $24,700. Families receiving child benefits saw a $200 increase in the median transfer, which reached $2,600.
Almost 9 out of 10 families (86%) and 8 out of 10 people not living in families (79%) received some form of government transfer in 2009. That year, the total amount transferred to all Canadians increased 10%. More than half of this increase took the form of Employment Insurance (EI) benefits.
The number of families receiving EI benefits increased 20% to 2.3 million, while the number of unattached individuals receiving EI climbed 29% to 520,000 people. Among the families that received EI benefits, the median amount rose 22% to $6,100.
Working income tax benefits increased to $800 per recipient, following changes to the program. For families, GST credits, provincial tax credits, social assistance and workers' compensation benefits all remained stable in 2009.
Little change in incidence of low income
Nearly 9.6% of the population (3.2 million people) lived in low-income families in 2009, a level that was virtually unchanged from 2008. About 9.5% of Canadians aged 17 and younger (634,000 children) lived in low-income families, a slight increase from 2008. However, this proportion was roughly half the 1996 peak of 18.4%. The incidence of low income among children living in two-parent families was 7.3% in 2009, up slightly from 2008.
Among seniors living in families, the incidence of low income has remained low—it has been below 3% for most of the past 20 years. In 2009, for example, 1.5% of seniors living in families had low income. But among unattached seniors, the incidence of low income was 14.3% that year. By contrast, unattached individuals under age 65 had more than twice that rate of low income, at 31.1%.
From 2007 to 2008 and from 2008 to 2009, the turnover in the low-income population remained balanced—almost the same proportion of families moved into a low income situation as moved out of it, about 3%.
- Date modified: