
Business, consumer and property services

Archived Content
Information identified as archived is provided for reference, research or recordkeeping purposes. It is not subject to the Government of Canada Web Standards and has not been altered or updated since it was archived. Please "contact us" to request a format other than those available.
Related information
From knowledge-based technology jobs and financial services to flipping burgers at the local fast food restaurant, service-related jobs have taken over an increasing part of the Canadian economy. In 2011, more than three out of every four working Canadians—11.6 million people—worked in service jobs. The GDP of service industries totalled $906.6 billion, about three-quarters of Canada's GDP.
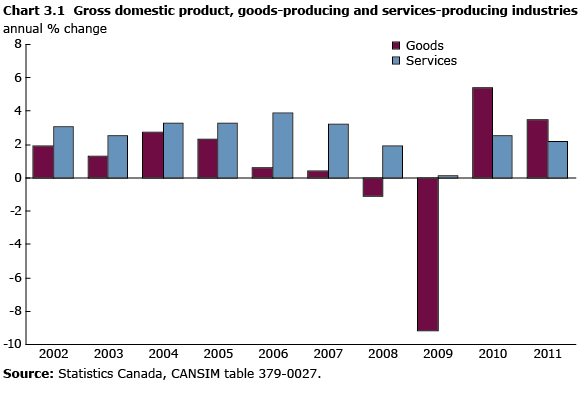
The 2008–2009 recession had a bigger impact on goods-producing industries than it did on services-producing industries. Coming out of the recession, Canada's real GDP grew at 2.6% in 2011, following a 3.4% increase in 2010. The production of goods grew 3.5% in 2011 while that of services expanded 2.2%.
Women and services
The proportion of the labour force working in service industries also increased over time—from 74.8% in 2001 to 78.0% in 2011. Women are more likely than men to hold service jobs. In 2011, 54.7% of employees in service industries were women. The health care and social assistance industries employed an especially large number, with 1.7 million women occupying 82.2% of jobs in the field.
In almost all provinces, the proportion of GDP accounted for by service industries has been steadily increasing. The provinces with the largest service concentrations in 2011 were Nova Scotia (78.8%), Prince Edward Island (76.9%) and British Columbia (76.3%).
Resource-rich provinces tend to rely more on the goods-producing side of the economy. In Newfoundland and Labrador, the share of GDP from services has fluctuated more than in most provinces—from 66.3% in 2001 to a low of 52.8% in 2007. In 2011, 58.6% of the province's economy came from services.
In Alberta and Saskatchewan, two provinces where resources are booming, services have grown in recent years. From 2001 to 2011, the proportion of GDP from services rose from 55.2% to 60.8% in Alberta and from 58.2% to 60.5% in Saskatchewan. Despite this growth, both provinces remain below the provincial average of 71.7%.
Urban areas (Census Metropolitan Areas and Census Agglomerations) have a large concentration of service jobs, at 80.2% of total employment in 2011, compared with 66.8% in rural areas. During the 1990s and 2000s, almost all urban areas became more service-oriented.
The largest concentrations of service employment in 2011 were in Ottawa−Gatineau, Victoria, Kingston and Halifax—all of which had between 86% and 90% of their workforces employed in service-related jobs.
Earnings in services
Earnings in the services sector can vary widely. In 2011, the average weekly earnings of the services sector was $801, compared with $986 in the goods-producing sector.
Workers in accommodation and food services were the lowest paid workers in the service sector, with average weekly earnings of $397. Retail trade workers earned an average of $611 per week.
The highest salaries in the services sector are found in industries requiring specialized knowledge, such as information and culture, finance and insurance, professional, scientific and technical services, public administration, and management. Average weekly earnings in each of these industries in 2011 ranged from $934 to $1,094.
Business services
With the growth of the service economy, business support services have become more important to the Canadian economy. Business services are services provided to the business community rather than to the general public. They increased from $534.7 billion in 2001 to $693.5 billion in 2011.
In 2011, professional, scientific and technical services contributed $61.6 billion to GDP, about 4.9% of Canada's total GDP. Notably, computer systems design and related services grew quickly, increasing its share of GDP from 0.9% in 2001 to 2.4% by 2011.
Firms in the 'miscellaneous professional, scientific and technical services' industry—specialized design services, management and other technical consulting, research and development services and other scientific and technical services—remained unchanged in their share of GDP from 2001 to 2010 (1.2%).
Firms in Alberta accounted for 31.6% of business services revenues, followed by Ontario (27.2%), Quebec (19.7%) and British Columbia (12.9%). The largest gain in operating revenues was in Saskatchewan (36.7%), followed by Nova Scotia (9.7%), Alberta (8.5%) and Quebec (6.2%).
- Date modified: