
Statistics Canada
www.statcan.gc.ca
Common menu bar links
Section S: Construction and Housing
Archived Content
Information identified as archived is provided for reference, research or recordkeeping purposes. It is not subject to the Government of Canada Web Standards and has not been altered or updated since it was archived. Please contact us to request a format other than those available.
Marion Steele, University of Guelph
Summary Statistics of Construction (Series S1-64)The statistics in this section are arranged in five subsections. The first subsection (series S1-64) contains summary statistics for construction by type and by region. It also contains general statistics of the construction industry. The second subsection (series S65-166) contains statistics for non-residential construction by the sector 'purchasing' the construction. The third subsection (series S167-219) covers residential construction, the fourth (series S220-246) the housing stock and the fifth (series S247-335) mortgage funding. A major difference between this section and the similar section in the first edition of Historical Statistics of Canada is the elimination of most of the series on repair construction detail. On the other hand, a large number of series have been added. These include the series on mortgage funding and housing unit costs.
A substantial amount of the data in this section was obtained directly from the producing agency. In some cases the series do not appear in any publication. In other cases the series available in published sources are obsolete because of data revision and reclassification. The sources of the data in this section are given below.
Statistics Canada publications: Private and Public Investment in Canada, Outlook, (Catalogue 61-205); Private and Public Investment in Canada, Outlook, Mid-Year Review, (Catalogue 61-206); Construction in Canada, (Catalogue 64-201); Building Permits, (Catalogue 64-203); National Income and Expenditure Accounts, 1926-1974, (Catalogue 13--531) and subsequent annual issues, (Catalogue 13-201); Housing Starts and Completions, (Catalogue 64-002); Fixed Capital Flows and Stocks in Manufacturing, (Catalogue 13-522); Fixed Capital Flows and Stocks, (Catalogue 13-211).
The tables are available as comma separated value files (csv). They may be viewed using a variety of software. You may have to create an association between your software application and the csv files. The pdf files should be used to verify table formats. For example, footnotes appear in a column to the right of the cell they reference in the csv files; while in the pdf files footnotes appear as superscript numbers.
Summary Statistics of Construction (Series S1-64)
General note
Virtually every series in this section and the next has to do with non-residential construction. There are three major sources of these data. One of these, the building permits survey, gives the value of building construction and some engineering construction at a point in time usually slightly before construction starts. Currently its geographic coverage is very good because almost all municipalities require building permits. A second source, the industry censuses, survey producers of construction output and have varied greatly in coverage. Further information on these two sources is given in notes to individual tables.
The most important of the three major sources used in this section is the capital expenditure survey. Information about this survey was obtained from Private and Public Investment, Mid-Year Review, 1977, Construction in Canada, Private and Public Investment in Canada, a xeroxed paper written in 1973 and from the staff of the Capital Expenditure Section, Construction Division, Statistics Canada. Unless otherwise indicated, references to estimation procedures used by this survey refer to those used in 1973.
The capital expenditure survey gathers information on investment in machinery and equipment and in construction, and information on repair expenditure. It is a survey of the purchasers of construction and other capital goods rather than of suppliers and its values relate to a later point in time than building permit values. Currently over 24,000 establishments are surveyed, compared with about 16,000 in the 1950s; these include institutions and governments as well as businesses. This survey is not a random sample survey. Instead, generally the aim is to get complete coverage of all establishments with sales greater than a certain cut-off amount. This cut off varies by industry, by province and over time. It was typically $500,000 in the mid-1970s and $200,000 in the early years of the survey.
Estimation of total construction for an industry is typically done in two stages. First, construction from the survey is divided into two categories. For manufacturing, for instance, the first category is construction purchased by ongoing establishments. The second category, called 'net additions', is roughly construction creating a new establishment. The first category is then grossed up to get an estimate for the universe of ongoing establishments. Grossing thus accomplishes coverage of non-surveyed and non-responding establishments; it is done using related series.
It can be seen that a problem for this survey is capturing construction which creates a new establishment, especially if the new establishment is also a new firm. A new firm may not be noticed until construction is well under way or has been completed. This is a problem of identifying the universe, not a sampling problem. Another problem for the survey is the grossing factor. An alternative grossing factor might be the ratio of the change in shipments in the industry, exclusive of 'net additions' establishments, to the change in shipments in the sample used for grossing. These difficulties should not be exaggerated, however, since it is estimated that survey coverage (the total in both categories before grossing) is about 90 per cent.
Construction is divided into new and repair. Conceptually new construction is construction having a life of more than one year. Thus, additions are included as well as entirely new buildings and engineering structures. Construction cost encompasses all overhead costs such as administrative, architectural, legal and engineering costs. It includes land improvement costs, so that land servicing as well as site preparation costs are covered. It also includes the cost of installed equipment such as elevators, heating systems and air conditioning. The construction may be carried out under contract or by the 'purchaser's' own labour force.
Construction does not include the purchase of existing buildings or land. Because land is excluded, 'new construction' understates substantially the non-equipment portion of investment by particular industries. Of course, industry investment will also be further understated when a firm purchases existing buildings from a firm in another industry. The use of rented buildings is attributed to the firm owning the building, not the firm renting the building. Thus a large part of all retail and office space and a small amount of industrial space is classified under 'other finance'. An exception to this is stores built under leaseback for some food chains; this construction is included under retail trade.
Repair construction is construction undertaken to maintain the operating efficiency of existing structures for the original life intended. Routine maintenance such as char service, sanding and snow removal is excluded.
There is some possibility that reported new construction excludes some activity which is conceptually included. Establishments report new construction under the heading 'capital' construction expenditure, and some may on occasion report only the construction costs they capitalize. This implies that the repair expenditure category contains some renovations and improvements which conceptually belong in the 'new' category. Accounting problems make it difficult to identify and report properly new construction, especially where the distinction between engineering work and machinery is a problem (e.g. petroleum refineries), and where categories of account, (as in government departments and institutions), are arranged in a format which does not allow an easy adaptation to the reporting categories of the survey.
Conceptually, the time basis for the capital expenditure survey construction data is work put in place. Because costs are often recorded on a cash flow basis, however, the reported data may lag behind the work put in place. The length of this lag is unknown. Respondents report expenditures, so that the lags may be very short if progress payments are frequent. It is also true that respondents are explicitly asked to report the value of holdbacks attributable to construction work done in the period concerned. Some holdbacks, however, are improperly reported for the period the payment is made, not for the period the work takes place. It is not known how important this problem is. Obviously it is potentially more important the longer the construction time of a project.
The capital expenditure survey was not started until 1941, and was carried out only in a limited way until 1946. Estimates of construction from 1926 to 1941 were first published in Public Investment and Capital Formation, A Study of Public and Private Investment Outlay, Canada, 1926-1941, Ottawa, 1945, (referred to as PICF). Total building construction was estimated by estimating the flow of building materials and then applying to this a ratio of the value of building construction to materials used. Ratios were available for several years in this period from censuses of construction. The breakdown into new and repair employed ratios from the same source. Building construction for some user categories was estimated directly. The residual included such categories as manufacturing, finance, universities. Virtually all engineering construction was covered by direct estimation.
The estimates in PICF, prepared under the direction of O. J. Firestone and M. C. Urquhart, were later replaced by estimates prepared under the direction of O. J. Firestone and appearing in Private and Public Investment in Canada, 1926-1951, Ottawa, 1951, (referred to as PPI). A major change was direct estimation for the manufacturing, construction, trade, finance (excluding banks) and commercial services sectors, using a sample of income tax returns of corporations. Further information on the PICF and PPI, including an assessment of the differences, is available in Kenneth Buckley's note for this section in the previous edition of Historical Statistics of Canada. Information here on PICF and PPI is drawn from that note.
For the years 1956 to 1976, the figures for non-residential construction by purchasing category are taken directly from CANSIM. Many of the figures in earlier years are different from those in any publication. When the series were prepared for CANSIM, in 1976 and 1977, great effort was spent on regrouping, etc. to get series continued back to 1956 on a consistent format. (The basic documentation exists allowing this to be continued back to 1952, but no earlier.) A major problem for this work was the change in the SIC about 1960. It is important to note that while the series are consistent back to 1956 in the sense of the sectors each series conceptually contains, they are not statistically consistent. The new SIC used a more all-inclusive definition of the establishment (see the general note to Section R, Manufactures).
For the period 1946 to 1955, the series are taken from Private and Public Investment in Canada, 1946-1957, PPI, 1946-57. Estimates in this source are given at the Canada level only. It must be pointed out that when series were being prepared for CANSIM by province, it was not found possible to generate series which aggregated to the Canada totals given in this publication. Consequently, the Construction Division no longer uses PPI, 1946-57. The disaggregation problems encountered by the Construction Division arose from the use for PPI, 1946-57 of adjustment procedures applied directly to Canada-level numbers rather than to disaggregates. Unfortunately, the unavailability of documentation does not allow this hypothesis to be checked. In view of the fact that PPI, 1946-57 incorporates numerous revisions to the original series and was used for the previous edition of Historical Statistics of Canada, it was decided to use it rather than the annual outlook publications published for those years.
Table S1-7
New and repair construction expenditures, in current and constant dollars, 1926 to 1976
Source: Series S1-3, for 1926 to 1955, the previous edition of Historical Statistics of Canada, series Rl-3; series S1-3, for 1956 to 1976, CANSIM Matrix No. 001190; series S4-7, see text following.
For concepts and procedures see the general note.
S1 is the series as produced by the Construction Division plus (S180 - S179 + S181 - S9); this adjustment was done to make series S1 consistent with residential construction as it appears in the National Accounts.
Unfortunately, constant dollar series corresponding to series S1-3 are not available for the entire period 1926 to 1976, because of revisions to series S1-3. Constant dollar series corresponding to recent current dollar values for series S1 are available in Private and Public Investment in Canada, Mid-Year Review, 1977, table 21, and earlier editions of the same publication. Series S4-7 was produced especially for this volume as follows. Series S4 is residential construction (S180 - S179 + S181) deflated using the GNP residential construction deflator plus non-residential con-struction (S1 - (S180 - S179 + S181)) deflated using the GNP non-residential construction deflator. The deflators are from National Income and Expenditure Accounts, (Catalogues 13-531 and 13-201). Series S7 is S1 divided by S4. Series S5 is S2 divided by S7. Series S6 is S4 plus S5.
Table S8
Estimates of total new and repair construction, 1896 to 1930
Source: Buckley, Capital Formation in Canada, 1896 to 1930, p. 128. The basic estimation procedure used for these estimates was similar to that used in PICF. First the annual flow of construction materials to construction uses was estimated. From this the total value of construction was estimated on the basis of data on the relation of the material component to the labour component and overhead and profit. The relation of material component to labour was the subject of substantial investigation. For 1896 to 1920 it was assumed that the ratio of materials to labour was constant, but for 1921 to 1930 this ratio of real inputs was varied. For the whole period it was assumed that overhead and profit was 14.3 per cent of the total value of construction.
Table S9-22
Total value of new construction work performed, by principle type of construction, 1926 to 1976
Source: for 1926 to 1950, the previous edition of Historical Statistics of Canada, for 1951 to 1976, Construction in Canada, table 6.
See the general note to this section for a description of concepts and procedures. Much more detail on type of structure than is given here is available in the source document. For instance under commercial are listed eight categories: office buildings; stores, retail and wholesale; theatres, arenas, amusement and recreational buildings; hotels, clubs, restaurants, cafeterias, tourist cabins; warehouses, store-houses, refrigerated storage, etc.; garages and service stations; laundries and dry cleaning establishments.
Conceptually, series S1 and S22 are the same. They are in fact different because statistical revisions in the residential and agriculture components made for the years 1961 and earlier are incorporated in series S1 but not in S18 (or the relevant component series in this table).
Table S23-28
Total value of new construction work performed, by region and by major type, 1951 to 1976
Source: Construction in Canada.
See the general note to this section for a description of concepts and procedures.
Table S29-58
Building permits issued, by region and major type, 1951 to 1976
Source: Mr. J. P. Delisle, Housing and Building Permits Section, Construction Division. Current data are published in Building Permits, Annual Summary.
Almost all municipalities require a building permit to be taken out for a new building or for alterations and additions to an existing building. Statistics Canada has been collecting data on permits issued for many years and detail is available on a variable basis in bulletins beginning in 1922. Over the last two decades great efforts have been put forth to expand coverage, so that 1,900 municipalities were covered in 1977. Unfortunately, however, series on a consistent coverage basis, and with the region and type of detail shown here, are not available. There are, however, just two instances where substantial breaks occur because of coverage increases: 1957-58 and 1962-63. Coverage in some census years is given in the following table.
| Building permits, geographic coverage | ||||||
|---|---|---|---|---|---|---|
Year |
Canada |
Atlantic provinces |
Quebec |
Ontario |
Prairie provinces |
British Columbia1 |
| (Per cent of population covered) | ||||||
| 1976 | 86 | 74 | 82 | 94 | 74 | 93 |
| 1971 | 82 | 52 | 79 | 93 | 73 | 91 |
| 1961 | 68 | 37 | 67 | 81 | 61 | 77 |
| 1951 | 57 | 34 | 51 | 72 | 45 | 73 |
| (Number of municipalities covered) | ||||||
| 1976 | 1,875 | 302 | 562 | 497 | 402 | 112 |
| 1971 | 1,445 | 102 | 325 | 527 | 381 | 110 |
| 1961 | 1,003 | 71 | 217 | 324 | 271 | 120 |
| 1951 | 439 | 35 | 70 | 177 | 75 | 82 |
1Includes Yukon Territory and Northwest Territories.
The percentage coverage of buildings erected in the intended universe is probably much greater than the percentage population coverage, because municipalities with substantial building activity are more apt to have well--organized building departments than those where building is quiescent.
Not all types of construction are covered by building permits. The biggest gap is non-building (i.e. engineering) construction. Some types of buildings also frequently do not require building permits, most notably municipal and local school buildings. Some types of construction may legally require a permit but may often - perhaps even ordinarily - proceed without a permit. This is the case with alterations and additions. According to a survey of Kenneth Buckley, in Saskatoon for 1941 to 1951 only 20 to 25 per cent of residential conversions were covered by a permit, (see Historical Statistics of Canada, previous edition, p. 500). It is the writer's impression that even in the city of Toronto, where enforcement of building regulations might be expected to be better than in smaller cities, a very large percentage of alteration jobs are not covered by a permit.
The values of buildings for which permits are taken out are understated. An incentive for understatement exists because the cost of a building permit generally depends on the estimated cost of the work. Comparisons by Mr. J. P. Delisle of the Construction Division of costs given in National Housing Act applications in the early 1970s with permit costs of the same buildings indicated that the permit values of single detached dwellings averaged 87 per cent of the actual value of construction and for multiple unit residential buildings, just 80 per cent.
The building permit series make no adjustment for permits which are allowed to lapse. The importance of lapses is not known but is generally thought to be unimportant. A very large number of apartment buildings covered by permits in the Toronto area in late 1973, however, had no visible work started as late as early 1975. The permits for many of these buildings were probably renewed and the buildings ultimately started, but permits as an indicator of starts were obviously very defective in 1973. This particular problem was presumably caused by the tightness in financial markets in early 1974 and the escalation of construction costs in 1973 and 1974, so that it is plausible that permits are only defective indicators on rare occasions. The views of some Toronto area building officials substantiate this.
The building permit series provide quite similar information to the Canadata (formerly Southam, and earlier, Maclean) contract award series. Some contract award series were given in the previous edition of Historical Statistics of Canada; unfortunately, however contract award data are no longer available free of charge. The timing of the contract award series is generally somewhat different from that of the permit series, because contracts are awarded before permits are taken out. In some cases, however, the Canadata series is apparently essentially a permit series. This is probably the case for most residential building. For apartments the Canadata contract series reflects the problem in 1973 referred to above in the discussion of the permit series, i.e. a very large proportion of apartment 'contracts' apparently were cancelled.
The permit series constitute a useful check of the construction series from the capital expenditure survey. Remembering that the permits lead construction by many months, and that values in the permit series probably represent understatements of over 20 per cent, the detail in the building permit and construction publications suggests that the capital expenditure survey substantially understates the construction of retail and wholesale stores and hotels, clubs, restaurants, cafeterias and tourist cabins.
Table S59
Value of building permits issued, 1910 to 1960
Source: previous edition of Historical Statistics of Canada, series R177.
This series like series S25-54, was produced by Statistics Canada and provides some indication of the effects of changes in geographic coverage, 1951 to 1960.
Table S60-64
Principal statistics of the construction industry (construction contractors), 1934 to 1976
Source: for 1951 to 1975, Construction in Canada (Catalogue 64-201); for 1934 to 1950, Construction Industry in Canada, (Catalogue 64-D-21).
A construction census was first carried out by Statistics Canada in 1917. It was not carried out for the years 1923 to 1933 nor for the years 1951 to 1974, although partial censuses were carried out providing data for 1967 to 1974. These gaps arose because of dissatisfaction with the quality of the census. It is very difficult to take a census of this industry. There are a very large number of small, widely dispersed establishments, and because of substantial fluctuations in demand the average life of establishments is short.
The data before 1951 are estimated very differently from those of the later period. For 1934 to 1950, all data come directly from the Census of Construction. Because of the intrinsic problems of identifying the universe, the coverage probably varied quite considerably from year to year, and in no year was coverage very good. Coverage of non-residential construction was much better than coverage of residential: for 1938, new residential construction reported in the construction census was just 37 per cent of all new residential construction expenditure as estimated in the national accounts (see series S180); for new non-residential construction the proportion was 66 per cent.
Note that these coverage figures are for all construction reported to the construction census, while series S60-64 relate only to construction carried out by contractors, i.e. series S60-64 do not cover construction carried out by industries other than the construction industry. The 1950 construction census report shows the value of work by contractors and builders to be 65 per cent of all work reported, while owner-builders, 'industrial organizations', steam and electric railways, utilities and governments account respectively for 5, 6, 2, 14 and 7 per cent.
Despite the incomplete coverage of this census, there seems no obvious reason why indexes and ratios constructed from it should be seriously biased and a number of investigators, including Buckley and this writer, have used the census in this way. Contained in the reports are 'capital invested', construction by detailed category (office buildings, stores, theatres, apartment houses, dwellings, etc.), and other useful information.
For 1951, a construction census was carried out, but after the results were compared with the capital expenditure survey, it was decided to discontinue the census. Starting in 1951 the value of work performed is taken from the response of 'purchasers' of construction to the capital expend-iture survey. In that survey respondents are asked the amount of their construction expenditure carried out by contractors. Salaries and wages are estimated as follows. For each of the residential, non-residential building and engineering construction sectors, reports from the contract con-struction industry are used to compute the ratio of salaries and wages to value of work performed; this ratio times the value of work from the capital expenditure survey yields the estimate of salaries and wages for each sector and thus total salaries and wages. The remaining series are estimated similarly.
From 1951 to 1966, the contract construction industry data were obtained from all firms with sales over $100,000. These firms were identified by using sources such as the Business Register and Dun and Bradstreet. Starting with 1967, census data were used as well as the large-firm data. The census data available for 1967 were those for electrical contractors. Starting with 1975 the census covered all parts of the construction industry. Also starting in that year census procedures changed. Firms with revenue over $500,000 in 1975 reported on the census long form. Financial data for all firms between $50,000 and $500,000 and for a sample of firms under $50,000 were obtained from Revenue Canada. Non-financial data for a subsample of this group (numbering 10,000 in 1975) were obtained by a short-form survey. The sample results were appropriately weighted to obtain the universe estimates.
Non-residential Construction (Series S65-166)
Note: see the general note to the previous section.
Table S65-71
New construction in primary industries, 1946 to 1976
Source: for 1946 to 1955, PPI, 1946 to 1957; for 1956 to 1976, CANSIM Matrix No. 001190 and 001194.
Agriculture and fishing are not included in the capital expenditure survey, essentially because both industries contain many small establishments which are difficult to survey. The agriculture estimation uses a benchmark obtained from a 1958 sample survey; this benchmark is then projected on the basis of farm income and sales of building materials. The fishing estimates are obtained from the Department of Fisheries and are estimated from their regional contacts. Construction in fishing industries includes items like docks, but boats are classified as machines. Fishing is dwarfed in importance by agriculture. For instance, in 1976 agriculture was $520.5 million while fishing was just $6.5 million. As described here, the agriculture and fishing series is probably of lower quality than the estimates based on direct surveys.
The forestry estimates are obtained by the capital expenditure survey. All establishments with sales over $500,000 are covered; in some provinces the cut-off is lower than this. It is likely that some forestry construction is incorrectly included in manufacturing with sawmills and with pulp and paper mills.
The mining and petroleum and gas estimates are probably of very high quality starting in 1967 (mining) and 1965 (petroleum and gas). These are the first years reflecting the use of a questionnaire especially designed for the industry. The mining survey is a census, i.e. there is no cut-off point – and indeed some exploration establishments which are captured do not report in the Census of Primary Industry. The petroleum and gas survey is also a census and uses the MAPID (Manufacturing and Primary Industries Division) form. The results of the survey are reviewed with industry representatives before publication.
Starting at the break-point, 1965, petroleum and gas includes exploratory and development drilling, including contract drilling. It also includes extraction from oil sands. Geological and geophysical exploration is excluded. Before 1965 the items included had varied to an unknown extent from establishment to establishment, depending on the establishment's interpretation of the definition of capital expenditure on the survey form. In 1960 also there was a conceptual change so that from 1960 gas processing plants are included; before this year gas processing is classified as manufacturing.
Starting at the break-point, 1967, mining includes on-property exploration and development but excludes outside and general exploration. As with petroleum and gas, the mining series before its break year contains some inconsistencies.
Estimates for the construction industry since 1975 are obtained using data from the Census of Construction (see notes to series S60-64). Prior to 1975, the data were obtained from both the partial census and the large-firm sample survey. The grossing variable was sales, with universe sales taken as total contract construction reported in the capital expenditure survey of all industries.
Table S72-93a
New construction in manufacturing by major groups, 1926 to 1976
Table S72-93b
New construction in manufacturing by major groups, 1926 to 1976 CONCLUDED
Source: for 1926 to 1955, previous edition of Historical Statistics of Canada; for 1956 to 1976, CANSIM Matrix No. 001198; for 1946 to 1976, the estimates are taken from the capital expenditure survey. The estimate has two components, as indicated in the general note to this section. 'Net additions' is partly expenditure creating new establishments. New enterprises are identified by regularly searching trade papers and through personal contacts in industry and government. Net additions also includes expenditure by ongoing establishments when that expenditure is judged to be irregular.
For the second component, the expenditure of ongoing establishments, the expenditure of the sample is blown up by the ratio of universe to sample shipments. Where expenditure by a sample establishment is regarded as irregular it is removed and placed instead in the 'net additions' component. For the 'final' expenditure estimate for year t, the blow-up or 'grossing' ratio uses shipments for year (t-2). Normally (for 1973) sample establishments include all those with $500,000 or more of shipments; where industries or provinces have relatively few establishments of this size, the cut-off is lowered to $200,000.
As can be seen, failure to discover all new projects which should be included in net additions is an important source of possible error. Problems in editing may also create errors. The activity of an establishment may change, indicating its industry classification should change. Ancillary activities of some organizations may be inadequately covered.
Respondents may find it difficult to separate machinery from construction and new from repair.
For the period 1926 to 1945, the estimates are based on the tax records of 358 corporations engaged in manufacturing throughout the entire 20-year period. The sales of these corporations amounted in 1946 to 38 per cent of the manufacturing industry total. The sample was stratified by in-dustrial classification and size group. Sample investment in each year was blown up by the 1945 or 1946 ratio of universe to sample sales within each stratum (Buckley, 1957, p. 111).
It is not clear how much the estimates are distorted by the choice of sample or the use of a constant blow-up factor. The selection criterion for the sample ensures that it excludes both companies which did not weather the depression of the thirties, and companies which were started to take advantage of opportunities in the late thirties and during World War II. A comparison of contracts awarded data for business and industrial building (series R170, R171, previous edition of Historical Statistics of Canada) with total non-residential building (series S14-S9) suggests that the estimation procedure has resulted in a level of the non- residential building estimates which is possibly too low for this whole period; and estimates for 1929 to 1939 may be too high relative to 1926 and 1946.
Table S94
New construction in manufacturing, 1871 to 1925
Table S95-106
New construction in manufacturing, by major groups, 1918 to 1925
Source: Fixed Capital Flows and Stocks in Manufacturing, 1926-1960.
These series were estimated by Professor T.K. Rymes not for use as a stand-alone series, but for use as components in the estimation of capital stocks and flows for later years. As a consequence he regards them as more appropriate as indicators of trends than as indicators of turning points.
The basic source data used for these series are the data on the value of capital invested, given in the first five decennial censuses of Canada, the two postal censuses of manufactures (reporting data for 1905 and 1906) and the DBS Annual Census of Industry, 1917 to 1943. Rymes' estimation assumes that the 'value of capital invested' is in fact the book value of fixed assets, i.e. the original cost minus accumulated depreciation. For an instructive and detailed account of problems encountered in the estimation, and their solutions, see Fixed Capital Flows and Stocks, pp. 64--71.
The construction expenditure series estimated by Rymes was used to extrapolate back the existing PPI series (S72). Thus series S94 reflects any defects in the level of that series. Rymes' raw gross fixed capital formation was estimated to 1943 and it is interesting to note that the differences between that series and the PPI series in the case of the example displayed (food and beverages) are akin to the differences between the contracts awarded series and the PPI series for total manufacturing. It is quite possible that Rymes' series is much more accurate than the official PPI series for the period 1926 to 1943. This would not be surprising in view of the fact that Rymes used universe data while the PPI estimates used data from an unrepresentative sample. Unfortunately, Fixed Capital Flows and Stocks does not display any of the original gross fixed capital formation series except that for food and beverages.
Prior to 1918, decennial rather than annual data for the book value of capital invested are available. Annual estimates for machinery and equipment by major groups were obtained by using an interpolator based on the estimated annual aggregate flow (domestic appearance) of industrial and electrical machinery and equipment. The same interpolator was used for all major groups. This series was then used to produce a construction series by using ratios of construction to machinery and equipment expenditure for 1926 to 1930. The resulting series were checked against buildings and fixtures data in the 1890 and 1900 censuses (the earliest censuses giving these components of capital invested separately). In some instances, as a result of this check, the series was adjusted. Further details of the estimation are given in Fixed Capital Flows and Stocks, 1926-60, esp. pp. 70, 71, 75).
Table S107-121
New construction in transportation, communication, electric power, gas and water utilities, 1956 to 1976
Source: for 1926 to 1955, previous edition of Historical Statistics of Canada; for 1956 to 1976, CANSIM Matrix No. 001202.
Details of the estimation of these series for the period 1926 to 1941 are given in PICF and in PPI, with a summary in the previous edition of Historical Statistics of Canada. Estimation procedures in recent years are generally similar to those used earlier. One difference is the usual current practice-as for manufacturing-of dividing the estimate into two components: 'net additions' and expenditure by ongoing establishments. It is convenient to give details of current estimation procedures by separate categories. It is worth noting that each transportation category includes relevant services to transport but coverage of these services is spotty.
For air transport, the expenditure of dominant airlines is included in net additions. The sample of ongoing establishments includes all those with revenue of $100,000 or more, with revenue the grossing variable. Coverage is good.
A sample is not used for rail transport because of the ease of covering the universe, which consists mainly of the Canadian National Railways and the Canadian Pacific Railways. The series includes actual annual outlays of the CNR for the whole period, but for 1941 and earlier CPR actual outlays are used only for 1926, 1929, 1930, 1933, 1937, 1941, with other years interpolated using related series.
The water transport sample currently (1973) includes all firms with revenues of $100,000 or more. Revenue is the grossing variable. Services to water transport does not use the two-component estimation procedure; instead all expenditures are classed as net additions. Two major service organizations are the St. Lawrence Seaway and the National Harbours Board.
The motor transport sector sample currently includes all establishments with over $100,000 revenue in smaller provinces, and $400,000 of revenue in larger provinces, with revenue the grossing variable. Included in this sector are interurban trucking and bussing. Where a trucking and ware-housing operation has less than half its revenue attributable to warehousing, the whole operation is classified as motor transport. Surveying this sector is difficult because of instability of ownership (especially in trucking) and because of the methods used to finance fixed assets, as well as because of other practices.
The urban transport sector follows the same estimation procedure as the transport sector. Included are the two subway systems. Not included is taxicab service.
For the pipeline sector, data are obtained from all units in the universe. This is possible because of the financial census carried out by the National Energy Board and by the Energy Statistics section of MAPID. There is some problem in converting reported figures to the required conceptual basis because of industry accounting practice. Included under pipelines are transmission and gathering lines; excluded are field lines which are included elsewhere (under petroleum and gas, series S70).
The telephone sample currently includes all firms with $100,000 or more revenue, except that some large corporations are included in net additions. Because of the dominance of the industry by large enterprises, the sample expenditure plus net additions accounts for almost all the total. A problem in this sector is the frequent use of used materials.
All telegraph expenditure is included in net additions. Included in this sector are railway telegraphs, microwave systems, cable companies and Canadian Overseas Telecommunications Corporation.
All terminal grain elevators are surveyed, but for country grain elevators only firms operating 10 or more are surveyed. The grossing variable for the latter group is number of elevators.
The electric power sector includes both establishments generating power for sale to the public and the small number of establishments whose major activity is distributing power. The large provincial utilities are included in net additions, while other enterprises with $100,000 or more of revenue make up the sample. Revenue is the grossing variable. The amount added by grossing is only about 3 per cent of the total. A special questionnaire has been used for this sector in the 1970s because of various reporting problems for this industry. One relates to own account construction. Another problem is the distinction between construction and machinery. The wording of the question on hydraulic production plant expenditure conveys the nature of the problem. Under this heading, the description of the construction element is 'water conveying, control and other hydraulic structures'; the description of the machinery element is 'turbines and generators and other installations consisting predominantly of recognizable machine components'. For nuclear plants the machinery item is just 'other installations consisting predominantly of recognizable machinery components'.
In the gas distribution sector all firms are surveyed, with estimation required only to account for the few non--respondents.
Starting in 1969 water systems was divided into two parts. The first, represented by private or provincially owned operations, was grouped as a separate category and placed in 'other utilities'. The second category, represented by municipal systems, was added to municipal government expenditure.
For broadcasting, the CBC is included in net additions and all units in the television and cable sector are surveyed. The radio sample currently includes all stations with revenue of $100,000 or more and the grossing variable is revenue.
Other utilities currently include warehousing, some water systems (see above), toll highways and bridges and taxicab service. For 1955 and earlier, also included are air, motor and water transport and services pipelines, grain elevators and broadcasting.
Table S122
Net capital formation in railway transport and telegraphs, 1850 to 1930
Source: previous edition of Historical Statistics of Canada.
As indicated by the title, this series is conceptually different from preceding series because it excludes that new construction and equipment expenditure which the railway companies regarded as replacement. This series was estimated by Kenneth Buckley using annual reports of both private and government-owned railways. He used information on a sample of roads to estimate both new construction and improvements. Details of his estimation are given in the previous edition of Historical Statistics of Canada and in the original source.
Table S123-127
New construction and repair, non-railway transport structures, 1901 to 1930
Source: previous edition of Historical Statistics of Canada.
These series include only government expenditures. Currently these types of expenditures are classified as government department expenditures. These series were estimated by Kenneth Buckley using the federal Auditor General's Reports and the Public Accounts of the provinces. Details are available in his Capital Formation in Canada, 1896-1930.
Table S128-140
New construction in trade, finance and commercial services, 1946 to 1976
The trade series are of lower quality than most others. Trade, especially retail trade, is characterized by many small units and large numbers of firms entering and leaving the industry each year. In addition, much of the construction for retail trade is classified under 'other financial' because real estate developers are the enterprises owning and building shopping plazas and office developments. Stores built under leaseback arrangements, especially common among some food chains, are included here rather than in the owner's industry group. This is one of the rare instances where expenditure is assigned to the user where the user is not the owner.
In all but the independent group, all existing establishments above about $1,000,000 in sales are included in the sample, with grossing by sales. New stores are included in net additions. Until 1976, the independent group was estimated using a benchmark obtained in the 1950s and the department and chain series as projector. Starting in 1976 the independents were sampled. The sample was 1,300 in 1976. Automotive trade includes service stations, garages and car dealers.
In the banking sector, all units in the universe are surveyed. The universe includes the Bank of Canada, but not the caisses populaires (which are not covered anywhere). Credit unions are included although the sample was not updated until 1978; most credit union expenditure, however, is in the net additions category. Currently (1973) insurance companies with fixed assets over $200,000 are sampled, with fixed assets the grossing variable. The sample is chosen from information in the Annual Report of the Superintendent of Insurance. Trust and loan companies are covered in the same fashion, with the sample chosen using data from the Financial Corporations Section of the Business Finance Division of Statistics Canada.
The 'other financial' sector includes land developers, building lessors, real estate firms and insurance agents. From some points of view the 'other financial' series represents a serious conceptual problem. It includes commercial and, in a few cases, industrial buildings built for rent, or speculatively built for sale by developers and others. Users of these buildings may be in many different industries. As can be seen this series has become of increasingly great importance in recent years, representing 20 per cent or more of non-residential building (and a much higher proportion of private sector non-residential building), as compared with less than 5 per cent in 1956. The shopping centres, multi-purpose projects such as the Manulife Centre and Toronto Dominion Centre in Toronto, and other construction included in this series represent a very substantial part of all new construction intended for use by commercial and financial industries. Some of the new head office space rented by various industries is therefore included in this series. It is noteworthy that the conceptual basis of much of these items is inconsistent with that of housing. In this latter case, construction is classified as housing whether it is owned by occupiers or by real estate developers or other landlords.
Estimation of the 'other financial' series is difficult. It is not possible to identify all units in this universe and the series is thus of somewhat questionable quality. The series is derived by first attempting to discover as many medium-- and large-sized projects and operations as possible; the reported data are then adjusted using building permit and contract award data for the current and preceding years.
Commercial services includes laundries and dry cleaners, theatres, hotels, restaurants, racetracks, ski developments, lessors of machinery and equipment, and any other organization providing services to persons or business, where that organization is not elsewhere classified. Hotels, the largest single component, is estimated partly by using a sample consisting currently of all those with rental revenue over $200,000, with rental revenue used as the grossing variable. The larger part of the hotel total, however, is net additions, i.e. construction of new hotels and motels. It is likely that many new motels are missed because their small size and remote location make them unlikely to be reported in trade journals or picked up by the Building Permits Section. Part of the expenditure in covered projects may be missed because the leaseholder may make the expenditure, not the owner. A laundries and dry cleaners series and a theatres series are also available separately; the amounts are very small. For other commercial, the universe is not easily identified. All expenditure is placed in the net additions category and information is gathered by a continuing search of trade publications and by other intelligence operations. Estimates for the non-covered portions are added, using information on motor vehicles, scientific and professional equipment and on building permits. The resulting series by its nature is downward biased and of lower quality than most other series.
Table S141-147
New construction in institutions and government departments, 1926 to 1976
Source: for 1926 to 1960, previous edition of Historical Statistics of Canada; for 1961 to 1976, CANSIM Matrix Nos. 001218, 001222.
Churches include all dioceses of the Anglican and Roman Catholic churches, and some parishes of the United Church. The grossing variable for the United Church sample is its membership, as indicated in its annual reports. New construction by other denominations is placed in net additions. The coverage for the various denominations could be low, to the extent that new construction is not covered by building permits. For 1934 to 1946, the 1947 estimate was projected back according to an index based on church construction as reported in the construction censuses; for 1926 to 1933 the projector was based on reported church contracts awarded.
For universities, all degree-granting institutions are surveyed, with enrolment the grossing variable (necessary only for non-response). Some new construction may be missed because university accounting systems classify it as current, rather than capital, as a consequence of government funding procedures. Before 1947, the estimate was projected back using an index based on the net change in the value of university plant and equipment and an estimated annual depreciation rate.
Local schools, provincial schools and private schools are each dealt with separately. Estimates for local schools are from the survey of school boards by the Public Finance Division, Statistics Canada. A problem is the possibility that some new construction is missed because school accounting classifies it as repair. Estimates for provincial schools (including community colleges and other non-degree-granting provincially supported post-secondary institutions) are from the survey of provincial departments by the Census of Construction Section. Accounting is also a problem here. For private schools, a universe became available recently for direct surveys with enrolment as a basis for imputations for non-response and non-coverage. For 1926 to 1946, the 1947 estimate was projected back using public finance data of varying coverage.
Estimates for provincial hospitals are from the survey of provincial departments by the Census of Construction Section. Estimation for municipal and private hospitals (including religious hospitals) uses a sample of all hospitals above a certain number of beds (the cut off varying by province), with this also the grossing variable. Accounting is a problem. For 1926 to 1946, the 1947 estimate was projected back using data on outlays on new construction of municipal hospitals in 1933, 1937, 1941, 1943, and data on total municipal new construction in these and the remaining years of the period.
Other institutions are surveyed directly with grossing by beds, where applicable. This group does not include government-owned institutions. It does include profit-making and non-profit homes for the aged, homes for the blind and deaf, orphanages, day nurseries and non-profit recreational organizations such as YM-YWCA's.
Government departments include departmental Crown corporations (for example, the Agricultural Stabilization Board) and part or all of a few agency Crown corporations. (The remaining agency Crown corporations, and all proprietary Crown corporations, are classified with the relevant industry group.) The Post Office is included here. Federal government new construction currently consists largely of passenger terminals, landing fields, docks, highways and other transportation-related construction and office and educational buildings. Estimates of expenditure are obtained from the Census of Construction. Before 1949, estimates for selected years (1926, 1929, 1930, 1933, 1937 and 1941 to 1948) were obtained by classifying individual items of expenditure as given in various government accounts into new and repair categories. The remaining years plus 1933 were interpolated using a variety of data; the likely error is indicated to be less than 10 per cent. Buckley's correction (previous edition of Historical Statistics of Canada, p. 495) for 1946 to 1949 is retained.
Provincial government new construction currently consists largely of highway, street and associated construction, with these items overshadowing the next largest items, sewage systems, disposal plants, water mains and office and other institutional buildings. Estimates are obtained from the survey by the Census of Construction. Before 1947, estimates were obtained in a similar fashion to the federal early estimates. The likely error for interpolated years in this early period is indicated to be less than 4 per cent.
Municipal government new construction currently consists mostly of waterworks and sewage systems, and road and other transportation construction. Estimates are from the Public Finance Division which surveys all provinces except Quebec. In some cases the data are actually collected by the department of municipal affairs. Quebec data are from a survey carried out by that province. Before 1947, estimates were obtained in a fashion similar to the early federal estimates. Data from 16 municipalities were important in the construction of the interpolation index used for various years prior to 1940. For later interpolations data on municipal expenditure from the Bank of Canada were used.
Table S148-160
New construction by governments and government enterprises, by level of government and by category, 1946 to 1976
Source: for 1946 to 1955, PPI, 1946-57 and previous edition of Historical Statistics of Canada, (series R16); for 1956 to 1976, CANSIM Matrix No. 001230.
The estimation procedures for government departments and for institutions are described in the previous section. The only government institutions included in the 'institutions' category are provincial hospitals, schools and universities and municipal hospitals and schools. All other government-owned institutions, for example homes for the aged and federal hospitals, are included under government departments.
Government business enterprises are generally government enterprises whose principal source of revenue is derived from the provision of goods and services to the public. They include all proprietary Crown corporations as well as an occasional agency Crown corporation in whole or part, and some other corporations. Departmental Crown corporations are classified with government departments. Part of the agency Crown corporation Atomic Energy of Canada Limited is included here. Examples of federal Crown corporations included are Air Canada, the Bank of Canada, the Canadian Broadcasting Corporation, Eldorado Nuclear Ltd., Canadian Wheat Board. Among the provincial corporations included are the liquor commissions and electric power companies. Among the municipal corporations included are electric power distributing companies, transit authorities, parking authorities. A complete list of federal and provincial corporations and a partial list of municipal corporations included are available from the Construction Division; also the Canada Year Book lists all federal corporations, by type (departmental, agency, Crown, other).
Under federal housing is included housing expenditure by federal government departments (expenditure for non-rental government-owned housing built for federal employees) and expenditure by federal government enterprises. The latter is generally rental housing and its inclusion is regarded by the Construction Division as a mistake so that this series may be revised to eliminate it. For 1960, federal government department expenditure is: Department of National Defence, $7.7 million; other, $5.4 million. For 1960, government enterprise expenditure is: federal-provincial agreements, $14.3 million; other, $0.8 million. All other housing, including housing expenditure by provincial authorities such as the Ontario Housing Corporation, is excluded from aggregate new construction built by governments and government departments. It can thus be seen that the treatment here of housing is different from the treatment of non-residential construction.
Table S161-166
New construction, federal government 1868 to 1930, provincial governments 1901 to 1930
Source: previous edition of Historical Statistics of Canada, series R120-125.
These series were estimated by Kenneth Buckley using the federal Auditor General's reports and the public accounts of the provinces. The railway series includes rolling stock purchased for federally owned railways. The provincial series in the 1920s is predominantly highway expenditure. Details of the estimation are given in Buckley's Capital Formation in Canada, 1896-1930.
Residential Construction (Series S167-219)
Table S167
Value of residential construction, constant (1971) dollars, 1926 to 1976
The price index used to deflate residential construction 1926 to 1950 is a weighted average of indexes of construction material prices and wage rates. The price index used for 1951 to 1970 is substantially changed from the one used before the revision of the National Accounts published in 1975. Like the previous index, it is an input index. Starting with 1957, however, instead of union wage rates it uses average hourly earnings and in addition to the indexes of the 'price' of labour and the price of materials, it incorporates an index of the 'price' of gross profit. The latter is the ratio of gross profit to the total value of new residential construction. For 1951 to 1956, because of data unavailability, the index uses union wage rates and excludes the gross profit component.
The most important aspect of the index used for 1951 to 1970 is the productivity adjustment it incorporates. This productivity adjustment is based on the assumption that real residential construction is proxied by the volume of materials used. Specifically, the labour weight is deflated by the ratio of an index of the real value of materials to an index of labour input. Because of erratic year-to-year movements in this ratio, for each of the 1951 to 1960 and 1961 to 1970 periods a ratio assuming a constant annual increase is used. This constant annual increase is 2.9 per cent for 1961 to 1970. It will be seen that the effect of this is to reduce the size of the labour weight by 1/1.029 each year, and the sum of the weights becomes increasingly below one.
This productivity improvement adjustment implies that when productivity improves, the same materials but less labour are used. The productivity adjustment thus overstates actual productivity if the real value of materials increases as a ratio of (on-site) labour merely because of the use of off-site labour to produce prefabricated components. The productivity adjustment is also upward biased if the residential construction mix shifts toward types of structures which are less labour intensive. In fact, in 1974 the price index used here for 1951 to 1970 broke down. That is, the increase it showed was absurdly small. As a consequence the GNP Division shifted to a different and clearly better index, which is used for 1971 to date. This index is the outcome of the assumption that the real value per dwelling unit for each of four types of structure (single detached, duplex and double, row, apartment) is constant. The evidence shows that this is a somewhat faulty assumption; for instance it is likely that the real value of the average single detached dwelling fell in 1974. The GNP Division is now in the process of producing an index which allows for varying real value per dwelling unit.
Table S168-180
New residential construction, by component, 1926 to 1976
Source: files of the Gross National Product Division
Residential construction is not easy to estimate and is subject to substantial error because of the large number of builders at scattered locations and because of the vast number of owners. In fact neither sellers nor purchasers of residential construction are the prime source of information for estimation. Rather, the fundamental source is municipal building permits. Since the late forties this has been importantly supplemented by National Housing Act data. Central Mortgage and Housing Corporation field offices have recorded the progress of construction of non-NHA as well as NHA houses for many years. An additional important source, especially for 1951 and earlier, is the census.
The estimates given here represent very substantial revisions from the estimates given in the previous edition of Historical Statistics of Canada. The revisions for 1926 to 1968 are part of the major revision of the National Accounts, published in 1975. These estimates are unlikely to be revised again soon. By the time this is published, however, the estimates for 1970 to 1976 will almost certainly have been further revised, especially the alterations and additions series. It is unlikely, however, that the estimators will have changed in any fundamental way from those used for 1970 to 1976. In the following it will be noted that the estimation is quite distinctly different for each of the periods 1926 to 1940, 1941 to 1950, 1951 to 1968 and 1969 to 1976. The estimates for the last two periods are discussed first and then the estimates for 1926 to 1950.
The discussion below draws heavily on information from the unpublished notes of Mr. J.P. Delisle of the Construction Division, including his Appendix D: Gross Capital Formation in Residential Construction, Quarterly Methodology (written about 1972); of Mr. D.H. Jones of the Input-Output Division (dated 25 January 1972, 23 March 1972, 12 January 1973 and 14 March 1977 respectively); and information from Mr. Hans Messinger and Miss Ellen Buckley of Gross National Product Division. The responsibility for opinions and errors remains with the author of this section.
For 1951 and later the major components of residential construction, work put in place in new buildings, by type (series S168, S169, S170 and S171) are estimated using three elements: data on dwelling unit starts, completions and units under construction; an estimator converting these data into dwelling units put in place; and unit values converting dwelling units put in place into values put in place. The starts survey is the source of the dwelling unit data and is discussed in the note to series S181-194.
For 1951 to 1968, units put in place are estimated for year t by province, by type, as
C(t)-k1 U(t-1,t)+k2 U(t)
where C(t) is the number of dwellings started and completed during year t, U(t-1,t) is the number under construction at the end of (t-1) and completed during t, and U(t) is the number under construction at the end of t. On the basis of work put in place in NHA houses, 1964-70, and the distribution of construction times of all houses, 1951-64, k1 and k2 are both taken as about .5. The parameters of this estimator are the same for all types of dwelling, despite the fact that large apartment buildings take much longer to complete than single detached dwellings. The understatement of the lag from start to expenditure because of this is probably not great, especially before the mid-sixties, because during this period few apartment buildings were large and apartments did not make up a large proportion of total starts.
It is worth noting that this work-put-in-place estimator is the equivalent of one-half starts plus one-half completions. The formula previously used was one-third starts plus two--thirds completions.
For 1969 to 1976, the estimator explicitly incorporates estimates of the lagged effect of starts on the value of work put in place. More precisely, the estimator for month t is
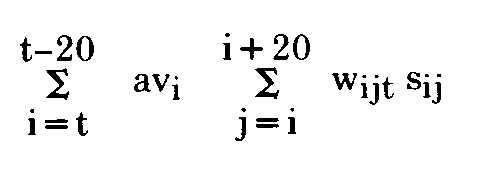
where avi is the estimated unit value of dwellings started in month i, sij is the number of dwellings started in i and completed in j (except that si,i+20 includes all dwellings completed in month i + 20 or later) and wijt is for a sample of NHA dwellings a three-year average proportion of work in dwellings started in month i and completed in month j which is put in place in month t. The annual estimate cumulates the monthly totals.
For 1951 to 1968 the estimated unit value for each type of dwelling and province is the average construction cost of relevant NHA dwellings as of the date of loan approval. (Prior to the 1975 revision, the 1951 to 1959 unit values, disaggregated by type but not by province were estimated using the relevant NHA construction costs and for 1960 and later years the 1959 values were extrapolated on the basis of the residential construction input price index.) Unfortunately, data from contract awards, building permits and conventional loan approvals show that NHA singles, doubles and duplexes were much higher in value than all houses before about 1954 (perhaps more than 25 per cent higher in 1959), of roughly the same value 1955-58, and of substantially lower value after this date, with the differential narrowing markedly after 1963. Thus the NHA series very much understates the rise in the unit value of houses 1951-63, with the distortion of change especially severe 1958-61. The same kind of evidence suggests, however, that NHA unit costs are not so seriously flawed as estimators of universe values in the case of apartment and row dwellings. NHA costs are apparently substantially greater than universe costs over the period 1951 to 1968 but the differential is generally not far from 10 per cent. The evidence for these statements is given in Steele, M., The Current Dollar Average Unit Cost of New Dwelling Units by Type, 1947-1966 (Ottawa; processed, Statistics Canada, 1968).
For 1969 to 1976, the estimated unit value for each type of dwelling is the building permit value, adjusted for undervaluation. No adjustment is made to link these estimates to the ones for 1951 to 1968 because the unlinked estimates yield little break between 1968 and 1969 in the aggregate, residential construction. This arises because while for singles the permit-based value is substantially above the NHA--based value, offsetting this is the fact that for apartments it is substantially below. The undervaluation adjustment to permit values is estimated by comparing the permit value with the estimated construction cost for a sample of NHA dwellings. For recent years the upward adjustment is 15 per cent for singles and 25 per cent for multiples.
Conceptually, part of the work put in place on new dwellings but given as a separate series, S174, is supplementary costs. This includes legal fees, architects' fees, surveyors' fees and interest charges during construction, NHA mortgage insurance fees. The mortgage insurance fees of private in-surers such as the Mortgage Insurance Corporation of Canada are not included. The supplementary costs estimator is the ratio of supplementary costs to construction costs of NHA dwellings times the construction costs of dwellings completed.
The estimator for conversions is the number of conversions reported in the building permit survey, adjusted for missing municipalities, times the value per conversion, adjusted for understatement. The missing municipalities factor (about 1.11 in 1971) is the ratio of total population to the population in reporting municipalities. The value adjustment factor (about 1.22 in 1971) is the ratio of the average value per start to the average permit value. The resulting estimates probably represent only a small proportion of the actual value of conversions, because they do not account for conversions done illegally and because the value of work is probably much more understated for conversions than for new buildings. Among the evidence on the first point are the results of the Census of the Prairie Census, 1946 as given in Statistics Canada, Supplementary Report on Housing Characteristics in Urban Centres of 5,000 and over (mimeographed, probably written in the late forties by Mabel Waddell). Far more conversions were reported than had been indicated by building permits. See also the discussion by Kenneth Buckley in the previous edition of Historical Statistics of Canada, p. 500.
The estimator for alterations and additions, 1951 to 1970 is the ratio of the value of alterations, improvements and repair reported in the permit survey to the value of new dwellings from that survey times the value of starts. This estimator thus does not account for improvements effected without a permit. In about 1973 the accounts for 1946 and later were revised to partially remove this deficiency. 'Hardware', an item included in personal expenditure on consumer goods and services, was redefined to include building materials, supplies and miscellaneous hardware not ac-counted for in the rent and capital formation components of GNE. The adjustment was made to hardware, rather than to residential construction, for two reasons. First, it was a less disruptive change. Secondly, the amounts included repair as well as improvements. If the adjustment had not been made to hardware, the amount accounted for by repairs would have had to have been split off and added to the existing residential repair estimate. This would not have affected GNE, because repairs are only implicitly included (in gross rents). It would have affected the GNP side of the accounts, however, via a reduction in net paid and, especially, imputed rent. Yet imputed rent was regarded as too low already.
The hardware adjustment is estimated as follows. First benchmarks for 1961 and 1969 are estimated as: repairs and improvements by homeowners and tenants as conservatively estimated using Family Expenditure survey data ($1.3 billion in 1969) minus residential repair and improvement already included in the accounts ($1.1 billion in 1969), itself reduced by an amount attributable to landlord repairs (conservatively estimated as $.3 billion in 1969). The resulting benchmark ($.5 billion in 1969) is regarded as an understatement both because of the conservative nature of the component estimates and because improvements made by landlords are omitted. Coincidentally, the benchmark in 1961 is almost identical to retail sales of hardware and building materials given by the 1961 Census of Merchandising. The benchmarks are interpolated and projected to other years on the basis of indexes of sales of retail hardware stores and retail building material outlets.
In 1976 the upward adjustment for improvements included in hardware was judged much too low and alterations and additions for 1971 to 1976 were revised as: (a) permit-based alterations and additions (see the description above for 1951 to 1970) plus (b) the sales of wholesale building material outlets to householders, adjusted by deducting from (b) (i) 10 per cent of (a), (ii) do-it-yourself repairs as estimated for the purpose of computing net rents, (iii) tool sales, (iv) materials for hobby use, (v) materials for owner-builders of new dwellings. The new total for alterations and additions plus hardware (adjusted to remove tools) equals about 140 per cent of improvements estimated using FAMEX data, unadjusted for understatement by respondents. S.A. Goldberg in 'Non-sampling Error in Household Surveys', International Statistical Institute Bulletin, vol. 36, part 2 cites evidence suggesting that for repair, respondents reported $65 per family in an annual survey while the cumulated annual total from monthly surveys was $171. This writer, assuming no under-reporting by FAMEX respondents and assuming landlords spend only 10 per cent per dwelling unit of the amount owner-occupiers spend, estimated improvements at $1.4 billion for 1974, 21 per cent of which was cottage improvements. See A Report on Estimation of Residential Construction (processed, Statistics Canada, Gross National Product Division, 1976, p. 38).
Mobiles, even those on footings, in practise apparently are not regarded as dwelling starts in the starts survey although the printed instructions for starts survey reporters exclude a mobile only when it is 'towable on its own chassis'. The estimator is domestic shipments (number) times the average value of mobiles reported in building permits, plus the value of imported mobiles. About 15 per cent of mobiles are reported in building permits. There is no deduction for mobile homes used as offices, on the grounds that this use is unlikely to be important in view of the fact that a criterion for inclusion in the shipments series is the existence of a kitchen.
Cottages are seasonal dwellings. They are estimated as the value in building permits times the undervaluation adjustment used for singles. To help ensure that dwellings labelled 'cottages' in permit reports are seasonal dwellings, all high-valued 'cottages' are excluded.
Prior to the revision of the National Accounts published in 1975 residential construction did not include real estate commissions on existing property. It is not clear what the basis of the estimates for early years is. For the later sixties the estimates assume that real estate commissions on (exist-ing) residential property is a constant proportion of new construction. For 1971 and later the estimate is projected by using real estate commissions paid under the Multiple Listing Service system. Probably MLS sales are a higher proportion of sales in slow markets than in hot markets, so that the error in this series is variable.
Series S180, defence housing, is expenditure on non--rental housing such as military barracks built by the Department of National Defence for its employees. This housing is not conceptually part of capital formation and so it is deducted from the total of series S172 to S178 to arrive at series S180, residential construction, National Accounts basis.
The estimates for real estate commissions and defence are described above in the note for 1951 to 1968. The remaining series were estimated by the author of this section. The description below is relatively terse; for a detailed rationale and for component series, see the sources listed for series S198-202.
For 1926 to 1950, work put in place in new buildings is estimated as a linear function of the current and lagged value of starts. The value of starts for each type of dwelling is estimated as the value per unit times the number of starts, plus supplementary costs. The estimation of the number of starts is described in the note to series S198-202.
For 1926 to 1942, the value per unit for urban dwelling units in one-to-three-unit buildings is the average value of units in the McLean (later Southam) contract award series labelled 'residences' times 1.05. The 1.05 factor is the ratio for 1959-62 of the adjusted average permit value of singles, doubles plus duplexes to the average value of 'residences'. The adjustment to permit values assumes they understate actual values by 10 per cent; this compares with the estimate given above of understatement in the 1970s of 15 per cent. The average value of residences is calculated after making an adjustment for 1921 to 1928 to the number of residences reported for Quebec, because of evidence that in those years the Quebec count referred to buildings not dwelling units.
This estimation yields a current dollar value of $4,205 in 1926, rising to $4,724 in 1928, a peak not attained again until the late 1940s. In constant dollars, the unit value is 38 per cent less in 1938 than it is at the 1928 peak. The pattern shown by this series is roughly corroborated by data from the 1941 Census on value of dwelling by length of occupancy (see Steele, 1972, table 7.2). It is strongly at variance with the assumption of 0.J. Firestone, Residential Real Estate in Canada, (Toronto: University of Toronto Press, 1951, p. 422), that constant dollar unit values of non-farm singles did not vary over this period. This assumption – made also for apartments and farm singles – underlies the residential construction series appearing in the previous edition of Historical Statistics of Canada.
For 1943 to 1950, in order to link these estimates to the 1951 to 1968 estimates, the value per unit for one-and-two-unit buildings is 1.27 times the value given by the estimator just described. As is pointed out in the note to the 1951 to 1968 estimates, the 1951 value on which this link is based is quite clearly much too high, so that the linking process yields a too-high level for the whole period 1943 to 1950 and later. The initial year of the linking series, 1943, was chosen because of the very low level of residential construction in that year.
For the whole period 1926 to 1950 the value per unit for rural dwelling units in one-to-three-unit (for 1943 to 1950, one-and-two-unit) buildings is taken as .531, the comparable urban value. This ratio is based on evidence from the 1941 and 1931 censuses.
For 1926 to 1942, the value per unit of 'other' dwellings is the average permit value of Montreal apartments times .91, the ratio of Canada to Montreal apartment values in 1946. The 1946 Canada value is .865, the average value of NHA apartments. This estimator is not as unsatisfactory as it might appear at first sight: in this period a substantial proportion of all new apartments in Canada were built in Toronto and Montreal - in many years over one-third - and the pattern of Toronto unit value for years it is available is consistent with the Montreal pattern (see Steele, 1972, tables 7.5, 7.6). In addition, because apartment starts are derived using this unit value (see note to series S201), problems in this estimator affect the starts series, but not the value of work put in place.
This estimation yields a pattern quite like the pattern for the values of one-to-three-unit buildings. The peak value is in 1929, at $4,164; and while the constant dollar value is 32 per cent less in 1938 than in 1929, it is substantially below the 1938 value both in 1933-34 and in the early war years.
For 1943 to 1950, in order to link these estimates to the 1951 to 1968 estimates (see the discussion for units in smaller buildings), the value per unit is 1.16 times the estimator just described.
To the above-described structure value per unit is added an estimate of supplementary costs (the costs of land improvements, and of architectural, legal and financial services). This is taken as 3.11 per cent of structure value for small buildings and 2.81 per cent for other dwellings. These ratios are from data on NHA loans approved in 1948 (O. J. Firestone, 1951, table XXII, p. 419).
The value of starts is converted into work put in place by assuming that 15 per cent of work started in any year is put in place in the following year; except that the carryover from both 1943 and 1944 is assumed at 20 per cent, from 1945 and 1946, 25 per cent, and 1947, 1948, 1949, 20 per cent. The higher ratios for 1943 to 1949 are used because of the long completion times (Central Mortgage and Housing Corporation, Housing in Canada, January, 1949) observed during this period of material and labour shortages.
The estimator for alterations and additions is the value of starts times the estimated ratio of alterations and additions to starts. For 1940, 1944 to 1950 the ratio is just the ratio of alterations, additions and repairs to new, from residential permit reports of 204 municipalities. Because the presumed effect of war restrictions on new building was greater in these municipalities than elsewhere, the 1941 to 1943 ratio is estimated from Census of Construction data, except that the census of construction-based ratio is reduced by 25 per cent in order to link it with the permit-based ratio. The census of construction-based ratio is also used for 1934 to 1939, because permit alterations and additions are not available for those years. For 1926 to 1933, the ratio is estimated using parameters obtained by regressing the census of construction-based ratio on the value of starts (see Steele, 1972, p. 170 for details).
As can be seen, the estimator for additions and altera-tions 1926 to 1950 is essentially the same as the estimator used for 1951 to 1970. And as noted above the latter is clearly seriously downward biased. It may therefore be concluded that the estimator for 1926 to 1950 is also downward biased. It is worth noting, however, that the ratio of alterations and additions to work in new buildings 1926 to 1929 is over 12 per cent while the analogous ratio (alterations, additions and conversions to work in new buildings plus supplementary cost) in the late 1960s is only about 8 per cent. In view of the much greater average age of the stock in the late 1960s than in the earlier period, this suggests that alterations are much less understated in the earlier period than later.
Table S181-189
Dwelling starts by region, 1948 to 1976
Table S190-194
Dwelling starts by type, 1949 to 1976
Source: Central Mortgage and Housing Corporation, Canadian Housing Statistics.
The precursor of the starts and completions survey was a survey of completions partially based on a sample designed by the young Nathan Keyfitz at Statistics Canada. This survey used reports from municipalities to estimate completions; it was carried out for 1945, 1946, 1947. In 1948 the starts survey was initiated. It was carried out by Statistics Canada with the help of CMHC, and was a complete survey of metropolitan and urban areas of 5,000 population and over. Outside these areas, about 400 sample areas were enumerated. Starting in 1963, the population cut-off for the complete survey was raised to 10,000 from 5,000. Some time before that date complete responsibility for the starts and completions survey was transferred to CMHC.
In late 1954 a redesigned sample was implemented; this indicated that the previous sample had deteriorated badly (CMHC, Canadian Housing Statistics, 1955, 4th Quarter, p. 5n) so that starts of singles in 1954 was understated by perhaps as much as 20 per cent. In view of this, a plausible adjustment to the published single starts series would add 14,000 units to the 1954 figure, 12,000 to 1953 and 7,000 to 1952. It seems reasonable to suppose that since 1954 there have not been substantial sampling problems. There has, however, certainly been at least one occasion when the starts have been substantially understated: in early 1959, 8,000 starts were missed. Because it is CMHC policy never to revise its published starts estimates, neither the estimates for 1949 to 1954 nor the estimate for 1959 were ever changed to correct the indicated errors. Series S181-194 are thus unrevised series.
In recent years, at least, and probably from the start of the survey, the major sources of information for starts survey enumerators have been CMHC inspection reports, in the case of NHA dwellings, and building permits, in the case of non-NHA dwellings. Because of the ease of discovering NHA starts as compared with the difficulties for non-NHA, especially in areas with lax or nonexistent permit systems, the starts survey is apt to be more accurate when NHA building is relatively important. Missed starts, when they do occur, are likely to be singles, doubles or duplexes in rural (sample) areas, because such areas are relatively time-consuming for CMHC field office staff to survey. More than likely missed starts are mistimed starts. Starts are attributed to the month they are reported, not the month the start actually occurred. A problem for enumerators is the fact that occasionally the type of dwelling, or the number of dwellings in a building, changes after the building has been started.
The completions series analogous to series S190-193 are not used in the estimation of residential construction 1951 to 1960. Instead revised series are used. These revised series are estimated assuming that the completions undercount between the 1951 and 1956 censuses and between the 1956 and 1961 censuses is given in each case by the change in census dwellings (occupied plus vacant) plus estimated demolitions minus mobiles minus reported completions. The undercount is distributed within each five-year period assuming that the pattern of actual completions is the same as the pattern of reported completions. The revised series and the amounts of the revision are given below:
| Completions estimates underlying residential construction estimates, 1951 to 1960 |
||||||||
|---|---|---|---|---|---|---|---|---|
| Singles | Multiples | |||||||
Year |
Revised completions |
Revised minus reported completions1 |
Revised completions |
Revised minus reported completions1 |
||||
| 19512 | 39,148 | 1,969 | 18,642 | 6,596 | ||||
| 1952 | 58,939 | 2,972 | 26,509 | 9,389 | ||||
| 1953 | 72,564 | 3,648 | 43,287 | 15,364 | ||||
| 1954 | 75,563 | 3,803 | 46,810 | 16,605 | ||||
| 1955 | 95,359 | 4,806 | 57,861 | 20,485 | ||||
| 1956 | 99,471 | 3,815 | 54,909 | 14,865 | ||||
| 1957 | 83,590 | 2,494 | 44,990 | 8,803 | ||||
| 1958 | 99,816 | 2,986 | 61,968 | 12,112 | ||||
| 1959 | 98,387 | 2,932 | 62,436 | 12,220 | ||||
| 1960 | 80,514 | 2,401 | 56,742 | 11,098 | ||||
| 19613 | 24,727 | 743 | 17,460 | 3,415 | ||||
It is apparent that the revised series presented here are probably greatly in error. The very small upward revision of singles is inconsistent with the evidence of understatement in the starts survey in the early 1950s. The very large upward revision of multiples is likely the outcome of the assumption that conversions net of mergers were zero. This assumption is prima facie implausible, especially for the early 1950s when there was still excess demand for housing. If indeed there were a substantial number of net conversions this would tend to increase the stock of multiple units and reduce the stock of single units, because conversion often is associated with the transformation of a single house into two or three apartments. It seems fair to conclude then that the large upward revision of multiples shown here is mainly the result of attributing to new building the increase in multiples brought about by conversion.
The net effect on the residential construction estimates of the error in these completions series and the error in the unit value series (see the note on series S168-180) is likely not very great. This is the fortunate outcome for the early 1950s of the fact that the overstatement of the volume of multiples (which are low in true unit value) and the understatement of the volume of singles (which are substantially higher in true unit value) tend to be offset by the overall overstatement of unit values.
Table S195-197
Mobile home shipments, 1967 to 1976
Source: Statistics Canada, Truck Body and Trailer Manufacturers, (Catalogue 42-217); Statistics Canada, Merchandise Trade, (Catalogue 65-203).
These series are included because the starts and completions surveys do not include mobile homes. An unknown number of mobile homes are in fact used as offices.
Table S198-202
Dwelling starts by type, 1921 to 1950
Source: Steele, M. L., Dwelling Starts in Canada, 1921 to 1940, (Toronto: unpublished Ph.D dissertation, University of Toronto); Steele, M. L., Estimates of New Residential Construction, 1941-1950, (Ottawa: processed, Statistics Canada, 1969).
These series are used to estimate residential construction, 1926 to 1950 (S179). They replace the completions series, R138, in the previous edition of Historical Statistics of Canada for 1921 to 1944. Series R138 was estimated by O. J. Firestone (1951). It should be noted that the completions underlying the residential construction estimates in the previous volume, for the years 1941 to 1950, are substantial upward revisions of this Firestone series (previous edition of Historical Statistics of Canada, p. 499).
O. J. Firestone completions 1921 to 1940 are estimated in two stages. First, completions for each decade 1921 to 1931 and 1931 to 1941 are estimated as equal to the increase in stock as given by census data plus demolitions and other dwelling losses minus dwellings added by conversion of existing buildings. Secondly, decade completions are allocated to years using a building materials index.
The use of a building materials index to yield the year--to-year pattern of new residential building is obviously objectionable. Because building materials are used for non--residential building, for repair work and for non-building purposes, it cannot be assumed that the pattern of their use will follow closely the pattern of new residential building. A second, less obvious problem in O. J. Firestone's estimation is his very low estimate of conversions. Essentially only those conversions authorized by municipal authorities are covered, yielding an estimate of 47,600 for 1921 to 1940 (previous edition of Historical Statistics of Canada, S139). Among the evidence that this estimate is a gross understatement is the fact that in the 1961 Census respondents reported 585,000 multiple dwellings built before 1920 (1961 Census, vol. II, 2, table 78) while the stock standing in 1921 was only about 335,000 (Steele, 1972, table 6.8), implying at least 250,000 conversions. (For Buckley's comments on O. J. Firestone's conversion estimates, and on the use of the building materials index, see previous edition of Historical Statistics of Canada, p. 500). Because the conversion process typically results in a loss to single detached stock and an addition to multiple stock, as a single house is converted into two or three apartments, an understatement of conversions implies an estimate of single completions which is somewhat too low and an estimate of multiples completions which is much too high. Thus it is not surprising that O. J. Firestone's estimates for urban areas in the 1930s show multiple completions nearly three times as great as singles completions despite the evidence of building permits, contract awards and the census of construction that apartment building was much weaker than other residential building in this period.
Like the O. J. Firestone estimates, series S198-202 have as their underpinning decade estimates derived using census and other data. The major difference from the O. J. Firestone results is the much lower estimate for the decade between the 1931 and 1941 censuses. The source of this difference is the much higher estimate of conversions. This is derived as an implication of the low ratio of multiple to single new construction as indicated by contract awards, censuses of construction and other data, at the same time as the much higher ratio of multiple to single gross flow given by the census reconciliations. (For details of the derivation see Steele, 1972, pp. 134-5 and Appendix VI).
Instead of the building materials index distributor used by O. J. Firestone to get annual estimates, series S198-202 essentially use the volume of residential building indicated by contract awards. This is accomplished as follows. First, the estimator for starts in urban one-to-three unit buildings is the number of contract awards 'residences' (corrected for a building-dwelling unit anomoly in Quebec, 1921 to 1928). The estimator for starts in other types of residential building is the value of apartment contract awards divided by the estimate of apartment unit value described in the note to series S168-180. The estimator for starts in commercial buildings is the ratio of such starts to all other starts in Montreal, times all other units in Canada. This ratio is 6 to slightly under 9 per cent in the early years of the period and well under 4 per cent in the last five years.
The remaining starts, those in one-to-three-unit buildings in rural areas, are estimated under two assumptions. First, it is assumed that the ratio of these starts to urban starts in one-to-three-unit buildings is the same in all years. Secondly, the difference in two-decade totals between the census-based estimate of all starts and the three components estimated as indicated above is assumed to equal rural starts in one-to-three-unit buildings. It will be noted that this estimating procedure means that while annual starts estimates summed over the two decades equal the sum of the census-based decade estimates, annual starts summed over a single decade are not constrained to equal the census-based decade estimate. This two-decade rather than one-decade constraint is used because (a) many of the component estimates used to derive the census-based decade estimates are subject to rather large error and the use of two-decade totals reduces the sensitivity to this error, and (b) there is evidence from the Quebec Municipal Statistics series, 'dwelling houses built', that the contract awards coverage of units in one-to-three-unit buildings did not change appreciably over 1921 to 1940.
For 1941 to 1950, the estimating procedure differs substantially from that used for earlier years, partly because the contract awards coverage changed substantially and partly because of the increased availability of alternative indicators. The estimating procedure is patchy, reflecting the varying quality of these indicators. Much of this variability is the result of disruptions caused by World War II and its aftermath. The estimation was carried out using two constraints. First, the decade total of starts had to be within the range 641,000 to 738,000, a range indicated as plausible by census-based decade estimates. In fact the total is 716,000. This compares with 594,000 completions for 1941 to 1950 shown by the unrevised series, (R-138) in the previous edition of Historical Statistics of Canada; and with 761,000 completions for June 1941 to June 1951 estimated for the purpose of preparing the residential construction estimates given in the previous edition of Historical Statistics of Canada. The second constraint is the requirement that the estimation procedure carried forward to 1951 had to yield an estimate of starts greater than the number yielded by the starts survey, but not more than 20 per cent greater.
For starts in one-and-two-unit buildings, the estimator for 1941 to 1945 is the 1940 estimate for units in one-to--three-unit buildings extrapolated on the basis of an index of starts of such units derived from Census of Construction data. This index is used because on the one hand, the coverage of this census appears stable for this period, and because permit and contract awards data both appear substantially affected by wartime regulations. For 1946 to 1950 the 1945 estimate is extrapolated using an index weighting equally data for this type of dwelling from the starts survey, from building permits; the Census of Construction data are not used because of evidence that its coverage of owner--builders increased and its editing practices changed. The ratio of rural to urban units is assumed to be .6.
For starts in apartment and other buildings, the 1941 estimate uses the 1921 to 1940 estimator. For 1942 to 1944, the 1941 estimate is extrapolated on the basis of an index in which Census of Construction data are weighted heavily. The 1945 to 1950 estimates are those given by the starts survey, and by starts derived from the predecessor completions survey.
The resulting estimates are much higher for the war years, especially 1942 and 1945, than the previous estimates (Canadian Housing Statistics, 1968, table 1). Evidently while war regulation dampened building considerably in urban areas, it was not so strong an influence in rural areas. The estimates show little change from 1945 to 1947 and then a very large increase in 1948 followed by additional growth albeit at a lower rate in 1949 and 1950. The previous estimates show a much smaller rise in 1948 and then virtually no growth in 1949 and 1950.
Table S203-205
Dwelling starts by area, 1868 to 1920
Source: Steele, M., Housing Starts in Canada, 1868-1920, (Guelph: processed, University of Guelph, 1977).
The estimation procedure used for these series is an adaptation of that used for later years. It has two major elements. First, decade starts are estimated using the identity that decade starts equals the change in occupied plus vacant permanent dwelling stock as given by the census, plus demolitions and other losses occurring during the decade minus dwellings added by conversions. This estimation is done for farm and non-farm components; farm units are defined for this purpose as dwellings on farms of 11 acres or more. The second element of the estimation is the construction of several annual distributor series. The Buckley urban distributor is Helen and Kenneth Buckley's index of urban building activity (1955, Appendix, table 0). The residential distributor incorporates data on residential building. It is essentially the same as the Buckley urban distributor, reflecting only Montreal residential building, until 1883. Starting in 1915 it reflects rural plus urban Quebec building. The urban mortgage distributor is based on the change in mortgage assets of insurance companies. The Pickett glass distributor is essentially James Pickett's window glass index.
Four separate non-farm series are produced using these distributor series as follows: the annual percentage change in the ratio of starts to the distributor is assumed to change smoothly; the estimation using this assumption is iterated until the decade sum of the results is within 5 per cent of the census-based estimate of decade starts. The non-farm estimates, S204, are weighted averages of the four series produced in this way, with the weights varying according to the quality of the basic distributor series. Specifically, for 1868 to 1870, S204 is simply the residential distributor-based estimates; for 1871 to 1877, these estimates and the estimates produced using the Pickett glass index are averaged; for 1878 to 1882, the mortgage distributor estimate replaces the Pickett glass estimate; for 1883 to 1900 the mortgage distributor estimates are weighted .25, the residential distributor estimates .75; for 1901 to 1914 these each have a weight of .25 and the Buckley urban estimates .5; for 1915 to 1920 the Buckley urban and the residential each have a weight of .5.
The farm estimates are produced using as distributor a series for 1868 to 1891 based on the change in mortgage assets of building societies and loan companies, and for 1892 to 1920, Buckley's annual farm series.
The results of this estimation are clearly subject to quite substantial error, especially in the case of the farm series, and especially for the period prior to 1883. At census years, however, the estimates are nicely consistent with the under -construction counts and scattered other data support them. The estimates are strikingly different from those of Pickett (previous edition of Historical Statistics of Canada, R149), especially for the early 1870s, when the high level shown by the Pickett series is essentially just the result of an arithmetic error, exacerbated by the annual distributor procedure used; and for 1915 to 1920, when wartime events damaged the usefulness of the glass index.
Table S206-219
Dwelling starts by principal source of financing and structural type, 1960 to 1976
Source: Central Mortgage and Housing Corporation, Canadian Housing Statistics.
The number of starts under the NHA in any year is not the same as the number of loans in that year because of the typical lag of about a month between approval and start. NHA loans under sections 58 and 59 (numbered sections 40 and 40A before July 1971) include loans made to borrowers 'unable to obtain insured loans from private lenders'. These are almost all home- ownership loans. Loans made by CMHC under the Assisted Home Ownership Plan and the Assisted Rental Plan are included under 'Federal funds, other'. Also included in this category are: other CMHC loans under NHA, including those loans under sections 58 and 59 which are for low income housing; loans under the Veterans' Land Act, the Farm Credit Act, loans for Urban Military Housing; government expenditure for housing built for federal government employees. Under 'institutional funds' are included loans made by life insurance companies, loan and trust companies, chartered banks, Quebec savings banks, mutual benefit and fraternal societies. Under 'other' are starts of dwellings financed from sources such as provincial governments, caisses populaires, credit unions, guarantees under the Farm Improvement Loans Act and individual lenders, as well as starts of dwellings financed without mortgage loans.
Table S220-224
Housing stock at census dates, 1871 to 1951
Source: 1871 to 1921: Steele, M., Housing Starts in Canada, 1868-1920, (Guelph: processed, University of Guelph, 1977); 1931, 1941: Steele, M., Dwelling Starts in Canada, 1921-1940, (Toronto: unpublished Ph.D dissertation, University of Toronto, 1972); 1951: 1951 Census vol. III, tables 2, 3.
The occupied figures for 1881, 1891, 1901, 1931, 1941, 1951 are taken directly from the census volumes. For 1871, the occupied total is that given in the census, vol. I plus the estimate for Prince Edward Island and the West by James Pickett Residential Capital Formation in Canada, 1871-1921, (Glasgow: processed, Royal College of Science and Technology, 1961, Appendix, table 1). For 1911 and 1921 the census dwelling count is not used because of confusion between building and dwelling unit in the instructions; the estimate here is the number of dwellings in the Yukon Territories and the Northwest Territories (plus the number of households elsewhere divided by the assumed ratio of households to dwelling units). This ratio is assumed 1.041 for 1911 and 1.054 for 1921. These numbers, and the assumed vacancy rate in 1921, were chosen after examination of contemporary data on crowding and vacancies. They yield a substantially smaller size of stock in 1921 and a slightly smaller stock in 1911 than Pickett's estimates, which are based largely on linear interpolation between census years.
Vacancies for 1871 to 1911 exclude prairies. For 1871 to 1901, the source is the same as for occupied dwellings. For 1911 the source is Pickett (1961, Appendix, table 1). For 1921, vacancies are assumed 2.24 per cent of stock. For 1931, urban vacancies are assumed 3.96 per cent of urban stock; this is the average rate observed in several cities in 1931 (O. J. Firestone, 1951, pp. 380, 381). In 1941 and 1951 vacancy data were once more collected in the census, and so figures for these years are from census volumes.
Temporary units, called 'vessels and shanties', are taken directly from census volumes for 1871 to 1891; for 1901 to 1921 temporary units are estimated using information on the number of prairie units of 'other' material of construction and the decline in the number of one-and-two-room dwellings. For 1931, the source is 1931 Census, V, table 85; for 1941 the source is a letter dated 1953 from F.G. Boardman of the Census Division, Statistics Canada.
Table S225-231
Dwelling units completed, urban structural conversions, urban demolitions and stock of dwellings at year end occupied by tenure, and vacant, 1956 to 1976
Source: Mr. Paul Delisle, Construction Division, Statistics Canada.
The number of completions is taken from the starts and completions survey of CMHC. The number of structural conversions is the number for which building permits are issued inflated by the ratio of the population in all areas to the population in reporting municipalities; the number of demolitions is estimated in the same fashion. The number of vacant dwellings at census dates (1 June 1956 and every five years after that) is taken from the census; the number of vacancies in intervening years is estimated assuming the compound growth rate is constant. The tenure of the stock at census dates is taken from the census; the tenure in other years is estimated by linear interpolation.
The change in stock from one census to the next is identically equal to completions minus all conversions (structural and nonstructural) plus all losses from stock. Thus
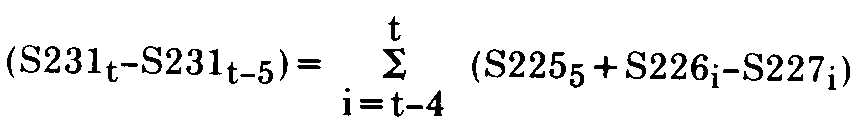
measures the net effect of errors and omissions in estimates of components of the change in stock, as long as the census stock count is correct. The residual is positive for each of the three earlier quinquennia (62,000 for 1956 to 1961, 16,000 for 1961 to 1966, 90,000 for 1966 to 1971) with Quebec and, to a lesser extent, Ontario accounting for most of these amounts; this pattern is consistent with the evidence of some under-reporting of completions in the late fifties and with the suspicion that unreported conversions were substantial in the late sixties. The residual is -31,000 for 1971 to 1976, suggesting there may have been a substantial number of two and three apartment houses changed back into single family use especially in Ontario and the western provinces.
Table S232-245
Apartment vacancy rates, by area and newly completed but unoccupied dwellings by type, 1957 to 1976
Source: CMHC, Canadian Housing Statistics and CMHC files.
The vacancy rates are derived from a sample survey. The universe excludes apartment buildings financed by CMHC and buildings completed within six months of the survey date. It also excludes condominium buildings, even when many more than six units in such a building are occupied under rental tenure. The information is obtained by interviews with building owners and superintendents.
The count of newly completed but unoccupied dwellings is obtained by a survey of all units completed within six months of the survey; unoccupied units are dropped from the survey after six months. An NHA house or duplex is called occupied if it is either occupied or sold. Other units are called unoccupied even if they are already sold or rented. An apartment building is not called completed until 90 per cent of all units are completed, so that completed but unoccupied units in an apartment building called incomplete by this criterion will not be counted. If the practice of leaving some floors of an apartment building incomplete until other units are completed is widespread, the CMHC completion criterion implies that it substantially understates the completed but unoccupied count.
Table S246
Non-farm vacancy rates, 1921 to 1949
Source: O. J. Firestone, Residential Real Estate, (Toronto: University of Toronto Press, 1951), table 69.
For 1921 to 1939, urban vacancies are estimated assuming the rate is the same as the geometric average of rates given in municipal reports of Toronto, Montreal, Winnipeg, Ottawa. Rural non-farm vacancies are estimated by extrapolating the 1941 Census vacancy rate using the urban vacancy rate series. For 1941 urban vacancies are estimated using the census urban rate; for 1940 and 1942 to 1946, urban vacancies are estimated for small cities using the 1941 Census rate, and for larger cities are estimated 'using the sample trend available for larger cities', (O. J. Firestone, 1951, p. 396). For 1947 to 1949, the rate used is extrapolated on the basis of data from 21 cities. For rural non-farm vacancies, the estimation is similar and uses the 1941 Census rate and 'the urban trend'.
Table S247-253
Net mortgage loans approved for new housing under the Dominion Housing Act and the National Housing Acts, by lender and type of loan, 1935 to 1976
Table S254-259
Net mortgage loans approved for existing housing under the NHA (1954), 1961-64 to 1976
Source: CMHC, Canadian Housing Statistics.
Net mortgage loans approved take into account cancellations and alterations (such as a change in the number of dwelling units in an apartment building). Sections 58 and 59 loans include loans made to borrowers 'unable to obtain insured loans from private lenders'. Section 34.15 loans are Assisted Home Ownership Loans; AHOP loans not made by CMHC are made under a different section. Section 15 loans include loans made to entrepreneurs for low-rental housing projects. Approved lenders are lenders approved on an individual company basis for the purpose of making NHA loans. The majority of these are chartered banks and life, loan or trust companies; some pension funds are also approved lenders.
The source publication gives dollar values for these loans.
Table S260-271
Mortgage loans on new residential property approved by lending institutions, by type of lender, by type of loan, 1948 to 1976
Table S272-283
Mortgage loans on existing residential property approved, by type of lender, by type of loan, 1948 to 1976
Table S284-289
Mortgage loans on non-residential property approved, by type of lender, 1948 to 1976
Source: CMHC, Canadian Housing Statistics.
Mortgage loans reported here are gross of cancellations and alterations; for NHA loans these are probably usually much less than 3 or 4 per cent. The possibility exists that they are occasionally much higher than this (see the comments above in the discussion of permit data). The data for these series are collected by a CMHC monthly survey; the life companies and the chartered banks report in summary form via their respective national organizations. The survey covers about 95 per cent of the universe. An NHA loan is called residential if at least 80 per cent of building it finances is for residential use.
The source publication gives S260-283 in terms of dwelling units and by structural type of dwelling unit as well as in millions of dollars.
Table S290-297
National Housing Act Mortgage Insurance Fund, 1955 to 1976
Source: CMHC, Canadian Housing Statistics.
Starting in June, 1969, the mortgage insurance fee is, if insured progress instalments are made, one per cent for home-ownership loans and one and one-quarter per cent for rental loans. Prior to that the fee was double these amounts. The application fee is $35. If default occurs, the lender receives the principal amount owing on the mortgage; approved borrowers' charges; interest on the principal owing at the mortgage interest rate for the period during which the loan was in default, or for 12 months, whichever is shorter; interest at the mortgage rate less 2 per cent for a maximum of six months, in addition to the 12-month period; any reasonable amount (effective June 1973) approved by CMHC for the legal costs of acquisition when making a claim.
Table S298-310
Sales and purchases of insured National Housing Act mortgages, 1957 to 1976
Source: CMHC, 1957 to 1976 Canadian Housing Statistics.
NHA-approved lenders must retain the servicing of mortgages they sell. Hatch has commented on S298-310 as follows: "The data in these tables must be interpreted with caution. They are intended to identify arms-length trading between non-affiliated firms; however, in some cases parent-subsidiary trades have been included in the data. There is also reason to believe that the data are incomplete due to a failure to report transactions properly." (Hatch, J. E., The Canadian Mortgage Market, (Toronto: Queen's Printer for Ontario, 1975.)
Table S311-322
Selected housing unit cost series, 1951 to 1976
Source: CMHC, Canadian Housing Statistics, (S312, S317, S320); Section C of CMHC book of tables (S311, S313, S314, S315); The Canadian Real Estate Association, Annual Report 1977 and The Canadian Realtor (S319); Smith, L.B., The Postwar Canadian Housing and Residential Mortgage Markets and the Role of Government, (Toronto: University of Toronto Press, 1974), table V, p. 23 (S322).
The average cost of dwelling units by type is the average value from building permits times an inflation factor. This factor is 1.15 for singles and duplexes, for 1957 to 1971; 1.17 for 1972 to 1976. The factors for apartments and rows are 1.25 and 1.28 for 1957 to 1971 and 1972 to 1976 respectively. These factors are the ratio of actual to permit value estimated for a sample of NHA dwellings. It is possible that there is some non-trivial overstatement of costs per unit of singles in the early period here because of the deficient coverage in these years of building in smaller centres where, there is reason to believe (see discussion of S168-180), new houses may be of relatively low quality.
The average cost of NHA dwellings is the average of costs as estimated by loan applicants at the time of approval. Average estimated (total) cost differs little from the average selling price of the same units. The average land cost varies with the proportion of fully serviced, partially serviced and unserviced lots. NHA houses use a variety of construction materials and are built under a variety of programs (e.g. AHOP). NHA apartments include highrises and walkups, buildings of wood and of steel, and are built under low income and other programs. The difference between the average costs of all dwellings and NHA dwellings is affected by NHA loan maximum. This maximum changes over time; e.g. it was $25,000 for home-ownership loans in early 1972, $30,000 for these loans in late 1972 and varied on a regional basis starting in June 1974. Changes in the maximum affect the geographic composition of NHA houses. None of the NHA series (S312, S316, S320, S321 and S326) are reweighted in order to eliminate distortions caused by the changing geographic condition. This point is especially important for the interpretation of the cost-per-square-foot index as a price index.
Multiple Listing Service properties in the MLS average include single detached and condominium dwellings, and probably some small apartment buildings. The average is computed as the total value of sales for Canada divided by the total number of sales. Thus the average in any year is affected by the geographic composition of sales. In 1961, Ontario accounted for 60 per cent of the number of all sales. British Columbia for 16 per cent, Manitoba for 8 per cent, Alberta for 8 per cent, Saskatchewan for 4 per cent, the Atlantic provinces for only 0.3 per cent and Quebec for 5 per cent; the respective numbers for 1977 are 49, 15, 5, 13, 4, 3 and 11. Weighting the provincial averages in 1976 by their 1961 weights, however, yields an average value of $51,847, almost precisely the same as the current weighted average value. It is possible that year-to-year changes are distorted by the practice of increasing the use of 'exclusive' listings in hot markets. The remarkable similarity of the movement of this series and the average of S329-334 suggests that this is not a problem of consequence.
Average urban cash rent is for 1961 and 1971 average urban cash rent as reported in the census. The estimates for other years are extrapolations based on the percentage changes computed by Lawrence Smith (1974, p. 23) using average rents reported in the Labour Force Survey. It is worth noting that average gross rent (which includes an allowance for utilities where these are not included in cash rent) increased by just 53.8 per cent between the censuses of 1961 and 1971, as compared with 63.2 per cent for cash rent. Rent increases by quarter, computed from the Labour Force Survey data, are shown in Loyns, R.M.A., An Examination of the Consumer Price Index and Implicit Price Index as Measures of Recent Price Change in the Canadian Economy, (Ottawa: Prices and Incomes Commission, 1972), p. 65. Average rents are currently computed quarterly by the Prices Division for use in GNP estimation, but are not available for publication.
Table S323-325
Average construction cost of new dwelling units, by type of dwelling, 1921 to 1950
Source: See source for S168-180.
For description of estimation see the note to S168-180.
Table S326-335
Selected housing price series (1971 = 100), 1952 to 1976
Source: CMHC, Canadian Housing Statistics, (S326); Statistics Canada, Prices and Price Indexes, (Catalogue 62--010), (S327, S335); CANSIM, Matrix No. D40680, (S328); Statistics Canada, Construction Price Statistics, Monthly Bulletin, (Catalogue 62-007), (S329-334).
For comment on S326, see the note to S311-322. The residential construction input price index starting in 1971 weights wages .359 and materials .641. For comments on S328 see the note to S167.
The new housing price indexes (S329-334) are based on prices provided by builders of single family housing who build 100 or more housing units a year. Smaller builders are included if they are able to provide prices for comparable models over a period of time. The price index is corrected for quality change in two ways. First, a cost-based correction is made where the change is a minor one; for example, if the quality of carpets installed in a given model is improved, the contractor is asked to estimate the cost change and this amount is removed from the amount of the price change. Secondly, a market-price-based correction is made when the quality change arises because of the introduction of a new model; that is, the relative prices of the new model and an existing model are taken to represent their relative quality. It can be seen that if builders are in the habit of pricing new models high relative to their equilibrium market value, and then letting the differential decline over the time the model remains on the market, the new model correction will overstate quality improvement and lead to a downward bias in the index. There is no sign that this is a problem of importance here, however.
These price indexes are for the value of the house and its associated lot. Separate price indexes are also calculated for lots and for house value excluding lot. These indexes are not published because of some doubts about the validity of the split.
The rental component of the Consumer Price Index is computed from rent changes reported for units in the Labour Force Survey in the preceding as well as current month. It is widely agreed that this index is severely downward biased. Some evidence on this is provided by the fact it shows an increase of only 21.4 per cent between 1961 and 1971 while the Canada average gross rent as reported by the censuses increased by 55.8 per cent for the same period, and the urban Canada average gross rent by 53.8 per cent. Only a quality improvement in the stock of about 2.5 per cent per year would explain the difference. It has been plausible to suppose (e.g. see Loyns, 1972) that the apparent bias in the rental component of the CPI is the result of the 'new unit' problem discussed above in connection with the new housing price indexes. Evidence from a recent CMHC survey, however, suggests that this may be just a minor part of the problem. In 1975 CMHC did a special follow-up of its 1974 Survey of Housing Units. The average increase in gross rent of the same units, November 1974 to November 1975, it found, with the percentage increase shown by the CPI rental component shown in brackets were: St. John's, 12.8 (5.4); Halifax, 11.2 (2.6); Saint John, 15.8 (8.0); Montreal, 8.7 (5.2); Ottawa, 10.0 (4.4); Toronto, 13.2 (6.8); Winnipeg, 15.1 (9.8); Edmonton, 18.6 (10.6); Vancouver, 10.3 (7.6) (CMHC, Analysis of Rental Market Focusing on the Impact of Removing Controls in 1977; Ottawa: processed, 1976). It is important to emphasize that the CMHC estimates are not estimates of the change in average universe rents, but rather are estimates of the price change using basically the same procedure as used in computation of the CPI rental component. The differences in results has yet to be explained.
You need to use the free Adobe Reader to view PDF documents. To view (open) these files, simply click on the link. To download (save) them, right-click on the link. Note that if you are using Internet Explorer or AOL, PDF documents sometimes do not open properly. See Troubleshooting PDFs. PDF documents may not be accessible by some devices. For more information, visit the Adobe website or contact us for assistance.