Statistics Canada
www.statcan.gc.ca
Common menu bar links
Christmas: Consumers’ season

Archived Content
Information identified as archived is provided for reference, research or recordkeeping purposes. It is not subject to the Government of Canada Web Standards and has not been altered or updated since it was archived. Please "contact us" to request a format other than those available.
by Jane Lin, Distributive Trades Division
‘ Tis the season to be jolly — and Canada’s retailers certainly feel that way when December arrives. It’s their busiest shopping month of the year.
Despite attempts to lure them out earlier, shoppers still tend to wait until the last minute. In December 2002 alone, they spent $30 billion in retail stores. That’s 10% of total annual retail sales or about 1.5 percentage points above the monthly average.
The impact of Christmas varies from product to product. Retail sales of toys, jewellery, perfume and music soar in December. On the other hand, auto dealers appear to be the most impervious to Christmas cheer; their sales actually fall to below-average levels in December.
Sales of individual commodities are analyzed on a quarterly basis. Music and videos have become a big hit with shoppers at Christmas. In the last three months of 2002 alone, music and videos rang up sales worth 39% of their entire annual total. Nearly 40% of spending on pre-recorded items such as gift-boxed DVD sets or CDs and tapes took place in general merchandise stores.
Canadians also like to give and receive cosmetics and fragrances. In total, they purchased $732 million worth of cosmetics and fragrances in the last quarter of 2002 — a little more than one-third (34%) of the annual total. Just under one-half (45%) of these purchases were made in general merchandise stores, and about two-fifths (41%) in drug stores.
Men also replenish their wardrobe during the holiday season. From October to December last year, consumers spent an estimated $2.3 billion on men’s clothing and accessories. This represented nearly 37% of sales for the entire year in a single quarter.
This article analyzes trends in Christmas retail sales from 1998 to 2002, using data from two Statistics Canada surveys: the Monthly Retail Trade Survey and the Quarterly Retail Commodity Survey.
Data sources and definitions
The Monthly Retail Trade Survey (MRTS) collects sales and the number of retail locations by province and territory from a sample of roughly 12,000 retail businesses. The MRTS universe is based on the 1980 Standard Industrial Classification. Each month’s data for retail sales are published by province and for 16 trade groups in The Daily, Statistics Canada’s official release bulletin.
The Quarterly Retail Commodity Survey (QRCS) looks at commodity sales within and across various types of stores. The sample is a subset of the MRTS sample, and includes more than 8,000 businesses and 100 commodities. It supplements the MRTS by providing a breakdown of retail sales by commodity.
Christmas shopping means big business
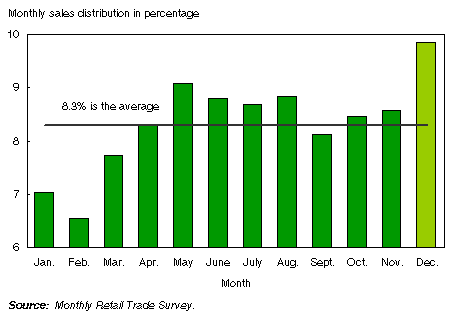
Overall, retail stores rang up $30 billion in sales last December 2002, accounting for nearly 10% of yearly sales.
Chart
December was the busiest shopping month in 2002
Christmas decorations and merchandise have been creeping into some stores just as soon as the Thanksgiving turkey is cooked. The aim is to entice shoppers to start buying earlier.
However, in total, shoppers are still making most of their purchases in December, by far the busiest month for many retailers. This pattern has been fairly stable in recent years.
Some retailers in particular see a large portion of their annual sales in December and rely on these sales to have a successful year.
Jewellery, music and toy stores rely on Christmas sales the most
Jewellery stores and music stores each generated almost 20% each of their annual sales last December.
Chart
Percentage of sales occuring in December by selected store type, 2002
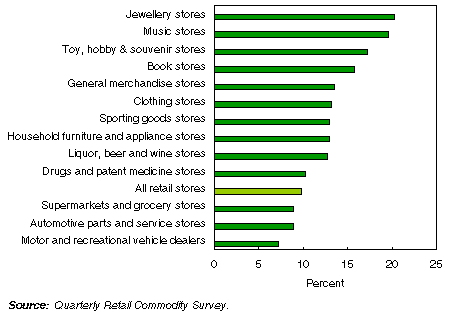
Shoppers flocked to toy, hobby, and souvenir stores, which rang up 17% of their annual sales in December last year.
General merchandise stores, which include department stores, generated almost 14% of their 2002 annual sales in December. Book stores, some of which sell holiday decorations, music and toys, rang up 16% of annual sales.
December sales for household furniture and appliance stores, including television, appliance and radio and stereo stores, accounted for 13% of yearly sales in 2002, the same proportion for liquor, wine and beer, clothing and accessories and sporting goods stores.
Data from the Quarterly Retail Commodity Survey show what products sell well during the holiday fourth quarter, and provide a breakdown in store shares for these items.
Toys, games and hobby supplies have Christmas in the bag
In 2002, almost half (48%) of annual sales for toys, games and hobby goods occurred in October, November, and December; this represented $1.3 billion.
Of the $1.3 billion, general merchandise stores captured 55% of sales, down from 58% in 1998, while toy stores accounted for 32% of sales, down from 36% in 1998.
Household furniture and appliance stores including household furnishing stores increased their share to 7% in 2002, up from 2% in 1998. The growth of electronic games and games system sales may have been at play here, as they are big sellers in stores classified under appliance and home electronics stores.
Cosmetics and fragrances: General merchandisers losing holiday market share
Shoppers purchased $732 millions in cosmetics and fragrances for the holiday fourth quarter of 2002; this was 34% of the annual spending on these products.
In 1999, general merchandisers commanded 51% of sales of cosmetics and fragrances in the last quarter. The "Eaton’s effect" saw upscale brands of cosmetics and fragrances sold at "going-out-of-business" prices. This may have enticed some shoppers to purchase more, which might explain why cosmetic and fragrance sales by general merchandisers have not since matched 1999’s high levels ($768 million in the fourth quarter).
In 2002, general merchandise stores had 45% of cosmetics and fragrances holiday sales, while drug stores had captured 41% of these sales in the fourth quarter. Apart from these two major players, relative newcomers — supermarkets and grocery outlets — quietly increased their sales proportion from 4% in 1998 to 6% by 2002.
Jewellery stores still have a lock on jewellery and watch sales at Christmas
Shoppers spent $775 million on jewellery and watches during the fourth quarter of 2002. This represents 37% of the annual total, down from 39% in the four previous years.
Consumers made almost three-quarters (71%) of their jewellery and watch purchases through jewellery stores in the last three months of 2002. General merchandise stores were the second most popular shopping destination, with 22% of sales; while clothing stores decked out 4% of jewellery and watch sales.
Men receive more than just socks
Men also replenish their wardrobes during the holiday season. Almost 37% or $2.3 billion of the annual spending on men’s wear and accessories was concentrated in the last three months of 2002.
While spending on socks, underwear, and hosiery typically increased in this period, so too did spending on accessories like wallets, ties, hats, belts and gloves. The fourth quarter also saw more spending on outerwear, including ski clothing, as expected for our cold Canadian winters.
For the most part, shoppers headed for clothing stores and shoe stores in the fourth quarter of 2002 for men’s clothing and accessories. These retailers captured 55% of men’s clothing and accessories market. However, general merchandise stores, which include department stores, decreased their share from 38% in 1998 to 34% by 2002. Sporting goods stores achieved 9% of these sales in the fourth quarter of 2002.
Music and movie sales a big Christmas hit
For Christmas 2002, 39% of annual sales or $677 million of pre-recorded CDs, DVDs and audio and video tapes occurred in the fourth quarter.
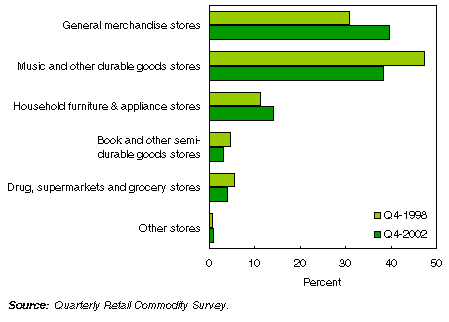
Consumers bought more music and movies in general merchandise stores than in music stores in the holiday quarter of 2002.
General merchandise stores squeaked by music stores to have the largest share (40%) of pre-recorded video and audio sales during the holiday quarter of 2002, a phenomenal increase from 1998’s fourth quarter share of 31%.
Music stores were close behind, with a 38% share in the last quarter of 2002, a dramatic reversal considering they accounted for nearly one-half (47%) of the pre-recorded music and video sales in the same period in 1998.
Interestingly, music stores sold proportionally more music and movies (42%) than general merchandise stores (35%) for the year as a whole.
Chart
Music stores fell behind general merchandisers in 2002 holiday sales of pre-recorded CDs, DVDs and tapes