
Economic Insights
Hires and Layoffs in Canada’s Economic Regions: Experimental Estimates, 2003 to 2013

Archived Content
Information identified as archived is provided for reference, research or recordkeeping purposes. It is not subject to the Government of Canada Web Standards and has not been altered or updated since it was archived. Please "contact us" to request a format other than those available.
by Wen Ci, René Morissette and Grant Schellenberg, Social Analysis and Modelling Division
Start of text box
This Economic Insights article presents annual estimates of hiring rates and layoff rates for Canada’s 69 economic regions (ERs) for the 2003-to-2013 period. It addresses several questions: (1) To what extent do hiring rates and layoff rates differ across Canada’s ERs? (2) What is the profile of ERs that display relatively low or relatively high layoff rates? (3) To what extent did the 2008-2009 recession affect hiring rates and layoff rates in various ERs? The study uses data from the Canadian Employer–Employee Dynamics Database and the Labour Force Survey to examine these issues. Attention is restricted to employees who were aged 18 to 64. Employees are defined as individuals with wages and salaries but no self-employment income in a given year. Incorporated self-employed individuals are excluded.
End of text box
Each year, thousands of workers in Canada start a job with a new employer or leave the job they held with a previous employer. The reasons for such transitions are numerous. Employers adjust the size of their workforces through hiring or downsizing in response to business conditions, technological change, shifting trade patterns and consumer preferences, and other factors. Some firms shrink or die while others expand or enter the market. In turn, workers are redistributed across the economy, from declining to expanding industries and from contracting to expanding firms. Furthermore, regardless of how well some firms perform in a given industry or how well some industries fare relative to others, thousands of Canadians retire, enter or re-enter the workforce, or change jobs each year. Overall, the flow of workers into and out of firms is a salient characteristic of the Canadian labour force.Note 1
While well-established metrics such as employment levels and unemployment rates provide valuable information on the Canadian labour force, they do not fully capture these flows of workers into and out of firms. To measure labour reallocation across employers, additional indicators such as hiring rates and layoff rates are needed.
The objective of this article is to provide new experimental estimates of hiring rates and layoff rates at the national, provincial and subprovincial level over the period from 2003 to 2013. Particular emphasis is placed on hiring and layoff rates within 69 economic regions (ERs) across the country. Information at this level of geographic detail is needed to inform discussions about the challenges and opportunities firms and individuals face within these local labour markets.
The hiring and layoff rates are constructed using administrative data sources, such as the T4 Statement of Remuneration Paid (T4 Slip), the T1 Income Tax Return, and Records of Employment (ROEs). These data sources contain the large number of observations needed to produce labour market information for small areas as well as the postal code information needed to organize it geographically. However, administrative data files are not designed with labour market indicators in mind and a number of conceptual and methodological issues must be addressed when they are used for this purpose. Details regarding these issues are discussed in the technical report that accompanies this article (Morissette, Ci and Schellenberg 2016). Given the novelty of the approach and the possibility of further methodological refinement, the hiring and layoff rates are presented as experimental estimates.
Hiring rates capture the movements of workers into firms. New hires are identified as employees who start a job with (at least) one new employer in a given year and still work for that employer the following year.Note 2 This definition is consistent with the approach taken by the Organisation for Economic Cooperation and Development (OECD 2009). It excludes many hires that result in short-term employment (e.g., summer jobs for students) and better captures the experience of workers who have a relatively strong attachment to the labour market than alternative measures (Morissette, Ci and Schellenberg 2016). The hiring rate is derived by dividing the number of new hires in a region by paid employment in that region.Note 3
Layoff rates capture the movements of workers out of firms due to a shortage of work or the end of contracts.Note 4 Layoffs are identified as workers who are laid off in a given year and who are not re-employed by that employer in the same or following year. The layoff rate is derived by dividing the number of employees in a region experiencing a layoff by paid employment in that region.
Hiring rates and layoff rates are useful complements to other labour market indicators. For example, unemployment rates show the percentage of labour market participants who, at a given point in time, do not have a job and are actively searching for one. However, not all unemployed individuals have been laid off. Some are new labour force entrants or re-entrants seeking work, while others are seeking re-employment after leaving a previous job for other reasons. Conversely, not all laid-off workers are unemployed. Some move quickly into new jobs without an intervening period of reported job search activity and others leave the labour force altogether.
Similarly, stable employment levels in a region do not imply the absence of employment opportunities, as firms hire new workers to replace those who retire or leave the workforce for other reasons. Relatively high hiring rates do not necessarily imply relatively low unemployment rates either. Some economically stagnant or declining regions may have relatively low hiring rates, reflecting high unemployment and the dearth of employment opportunities. Yet other regions with high unemployment may display relatively high hiring rates if they have a relatively high proportion of temporary jobs or seasonal jobs that come to an end every year but are renewed and filled by new applicants in the following year.
Finally, it is important to note that administrative data contain information on the ER in which individuals reside, but not on the ER in which they work. Although most individuals reside and work in the same ER, this is not always the case (Morissette, Ci and Schellenberg 2016). One implication is that an individual residing in, say, British Columbia who obtains a job in Alberta and commutes to work interprovincially, will be included in the hiring rate of the British Columbia ER of residence and not the Alberta ER of employment. In short, the hiring rates and layoff rates provide information on the labour market experiences of ER residents.
Hires and layoffs are sizeable relative to net employment growth
Regardless of general economic conditions, a large volume of worker reallocation across employers takes place each year. For instance, even though the number of employees aged 18 to 64 remained virtually unchanged at 13.2 million from January 2009 to January 2010, 2.4 million individuals were hired in 2009 (Table 1). During that year, 0.9 million individuals were laid off.Note 5 Among workers aged 25 to 54, total paid employment remained at about 9.7 million, although 1.5 million individuals in this age group were hired and 0.6 million were laid off in 2009. Over the 2003-to-2013 period, the annual number of hires and layoffs in Canada far exceeded annual net changes in employment (Chart 1). This finding highlights an important fact: net employment growth largely underestimates worker movements into and out of firms.
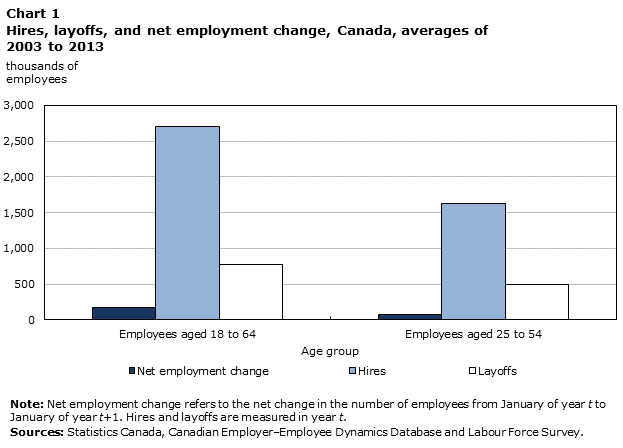
Data table for Chart 1
| Age group | Net employment change | Hires | Layoffs |
|---|---|---|---|
| thousands | |||
| Employees aged 18 to 64 | 168 | 2,710 | 776 |
| Employees aged 25 to 54 | 68 | 1,625 | 495 |
|
Note: Net employment change refers to the net change in the number of employees from January of year t to January of year t+1. Hires and layoffs are measured in year t. Sources: Statistics Canada, Canadian Employer–Employee Dynamics Database and Labour Force Survey. |
|||
Layoff rates vary across economic regions to a greater extent than hiring rates
From 2003 to 2013, 5.8% of employees aged 18 to 64 were laid-off, on average, on an annual basis (Table 2). During that period, Canada’s hiring rate―the number of individuals hired, as a proportion of average annual paid employment―averaged 20.2%.
Layoff rates differed across provinces to a greater extent than hiring rates. For instance, layoff rates in Newfoundland and Labrador averaged 15.7%, more than three times the rates of 4.7%, 4.4%, 4.9%, and 5.1% observed in Ontario, Manitoba, Saskatchewan, and Alberta, respectively. In contrast, hiring rates in Newfoundland and Labrador were slightly higher than those in Saskatchewan and almost identical to those in Alberta (Chart 2). Yukon and Nunavut displayed both higher-than-average layoff rates and higher-than-average hiring rates.Note 6
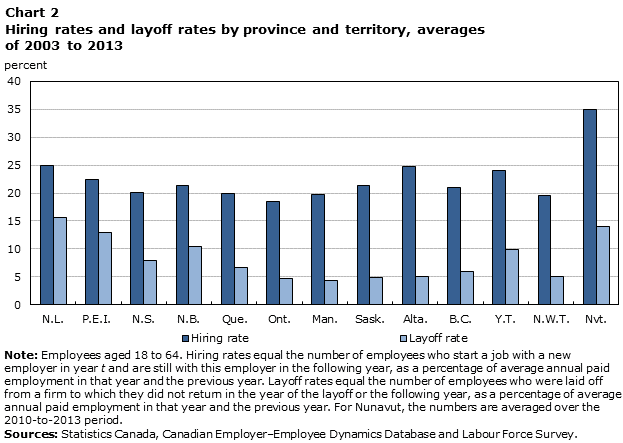
Data table for Chart 2
| Provinces and territories | Hiring rate | Layoff rate |
|---|---|---|
| percent | ||
| N.L. | 25.0 | 15.7 |
| P.E.I. | 22.5 | 12.9 |
| N.S. | 20.1 | 8.0 |
| N.B. | 21.3 | 10.4 |
| Que. | 20.0 | 6.7 |
| Ont. | 18.4 | 4.7 |
| Man. | 19.7 | 4.4 |
| Sask. | 21.4 | 4.9 |
| Alta. | 24.8 | 5.1 |
| B.C. | 21.0 | 5.9 |
| Y.T. | 24.0 | 9.9 |
| N.W.T. | 19.6 | 5.1 |
| Nvt. | 34.9 | 14.0 |
|
Note: Employees aged 18 to 64. Hiring rates equal the number of employees who start a job with a new employer in
year t and are still with this employer in the following year, as a percentage of average annual paid employment in that year and the previous year. Layoff rates equal the number of employees who were laid off from a firm to which they did not return in the year of the layoff or the following year, as a percentage of average annual paid employment in that year and the previous year. For Nunavut, the numbers are averaged over the 2010-to-2013 period. Sources: Statistics Canada, Canadian Employer–Employee Dynamics Database and Labour Force Survey. |
||
In relative terms, layoff rates varied across ERs to a greater degree than hiring rates. This can be seen by sorting ERs in ascending order of layoff rates and plotting both hiring rates and layoff rates (Chart 3). From 2003 to 2013, the ERs of South Coast–Burin Peninsula and Notre Dame–Central Bonavista Bay, Campbellton–Miramichi, and Gaspésie–Îles-de-la-Madeleine registered average layoff rates of 20% or more while the ERs of Ottawa, Toronto, Winnipeg, Regina─Moose Mountain, and Calgary averaged layoff rates that varied between 3.9% and 4.2%. The former group of ERs had average hiring rates that varied between 25% and 30% while the latter had average hiring rates that varied between 17% and 24%. As a result, layoff rates varied by a factor of 4.8 (or more) across these regions while hiring rates varied by a factor of less than two.
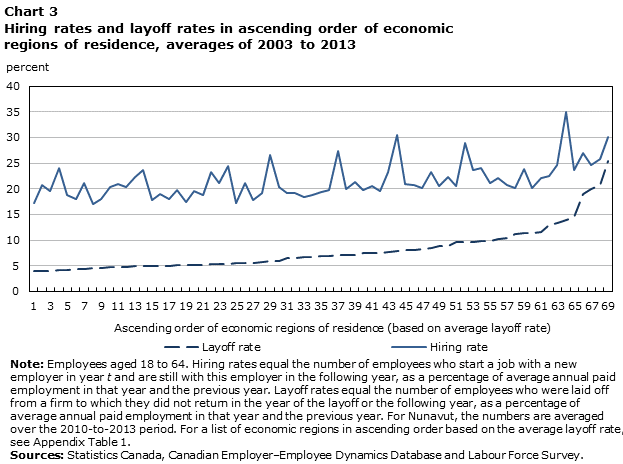
Data table for Chart 3
| Ascending order of economic regions (based on average layoff rate) | Layoff rate | Hiring rate |
|---|---|---|
| percent | ||
| 1 | 3.9 | 17.2 |
| 2 | 3.9 | 20.7 |
| 3 | 4.0 | 19.6 |
| 4 | 4.1 | 24.0 |
| 5 | 4.2 | 18.8 |
| 6 | 4.3 | 18.1 |
| 7 | 4.4 | 21.1 |
| 8 | 4.5 | 17.0 |
| 9 | 4.6 | 18.0 |
| 10 | 4.8 | 20.4 |
| 11 | 4.8 | 20.9 |
| 12 | 4.8 | 20.4 |
| 13 | 4.9 | 22.2 |
| 14 | 4.9 | 23.7 |
| 15 | 4.9 | 17.9 |
| 16 | 4.9 | 18.9 |
| 17 | 5.0 | 18.1 |
| 18 | 5.1 | 19.7 |
| 19 | 5.1 | 17.4 |
| 20 | 5.1 | 19.6 |
| 21 | 5.1 | 18.7 |
| 22 | 5.3 | 23.3 |
| 23 | 5.3 | 21.1 |
| 24 | 5.4 | 24.5 |
| 25 | 5.6 | 17.3 |
| 26 | 5.6 | 21.2 |
| 27 | 5.6 | 17.8 |
| 28 | 5.8 | 19.1 |
| 29 | 6.0 | 26.6 |
| 30 | 6.0 | 20.3 |
| 31 | 6.5 | 19.2 |
| 32 | 6.6 | 19.2 |
| 33 | 6.7 | 18.3 |
| 34 | 6.7 | 18.7 |
| 35 | 6.8 | 19.4 |
| 36 | 6.9 | 19.8 |
| 37 | 7.0 | 27.4 |
| 38 | 7.0 | 20.0 |
| 39 | 7.1 | 21.3 |
| 40 | 7.4 | 19.8 |
| 41 | 7.4 | 20.5 |
| 42 | 7.5 | 19.6 |
| 43 | 7.6 | 23.2 |
| 44 | 7.9 | 30.5 |
| 45 | 8.0 | 21.0 |
| 46 | 8.1 | 20.8 |
| 47 | 8.2 | 20.1 |
| 48 | 8.5 | 23.3 |
| 49 | 8.8 | 20.5 |
| 50 | 8.8 | 22.2 |
| 51 | 9.6 | 20.5 |
| 52 | 9.7 | 28.9 |
| 53 | 9.7 | 23.6 |
| 54 | 9.9 | 24.0 |
| 55 | 9.9 | 21.1 |
| 56 | 10.2 | 22.1 |
| 57 | 10.5 | 20.8 |
| 58 | 11.1 | 20.2 |
| 59 | 11.3 | 23.8 |
| 60 | 11.4 | 20.2 |
| 61 | 11.5 | 22.1 |
| 62 | 12.9 | 22.5 |
| 63 | 13.4 | 24.6 |
| 64 | 14.0 | 34.9 |
| 65 | 14.5 | 23.7 |
| 66 | 19.0 | 27.0 |
| 67 | 20.0 | 24.6 |
| 68 | 20.7 | 25.8 |
| 69 | 25.4 | 30.0 |
|
Note: Employees aged 18 to 64. Hiring rates equal the number of employees who start a job with a new employer
in year t and are still with this employer in the following year, as a percentage of average annual paid employment in that year and the previous year. Layoff rates equal the number of employees who were laid off from a firm to which they did not return in the year of the layoff or the following year, as a percentage of average annual paid employment in that year and the previous year. For Nunavut, the numbers are averaged over the 2010-to-2013 period. For a list of economic regions in ascending order based on the average layoff rate, see Appendix Table 1. Sources: Statistics Canada, Canadian Employer–Employee Dynamics Database and Labour Force Survey. |
||
Economic regions with relatively high layoff rates are less populous and have a relatively large proportion of temporary jobs
To provide more detail on regional characteristics, the 69 ERs were sorted on the basis of the average annual layoff rate over the 2003-to-2013 period and grouped into those in the upper-, middle- and bottom-third of the layoff rate distribution (Table 3). ERs in these groups had average annual layoff rates of 12.6%, 6.8%, and 4.7% respectively.
Of the 23 ERs in the upper-third of the layoff rate distribution, ten were in Atlantic Canada and 4 were in Northern and Eastern Quebec. ERs in the upper-third of the layoff rate distribution were less populous than those in the bottom third, with employment levels averaging 59,000 and 360,000 respectively. The employees who lived in regions with relatively high layoff rates earned on average $37,600 per year (in 2014 dollars) during the 2003-to-2013 period, compared with $45,300 for their counterparts living in ERs with relatively low layoff rates.
ERs in the upper-third of the distribution had larger shares of total employment in agriculture, fishing, forestry, and hunting, and larger shares of employment in small firms. Partly as a result of these differences, they also had proportionately more employees in temporary jobs (18%) than ERs with low layoff rates (11%).Note 7 Considering all 69 ERs, the proportion of employees in temporary jobs was a fairly good predictor of layoff rates in a given region, accounting for three-quarters of the variation in average layoff rates experienced by ERs over the 2003-to-2013 period (Chart 4). During that period, a 1-percentage-point increase in that proportion was associated with a 0.84-percentage-point increase in average layoff rates.
The strong positive correlation between layoff rates and the share of temporary jobs in ERs suggests that the 7.9-percentage-point difference in layoff rates between ERs in the upper-third of the layoff rate distribution, and those in the bottom third, partly results from differences in the relative importance of temporary jobs in regional economies. Multivariate analyses confirm this hypothesis. Once differences in the percentage of temporary jobs across regions are taken into account, the 7.9-percentage-point difference observed in the raw data drops to 3.5 percentage points. Hence, differences in the relative importance of temporary jobs in local labour markets account for more than one-half of the difference in layoff rates between ERs in the upper-third of the layoff rate distribution and those in the bottom third.
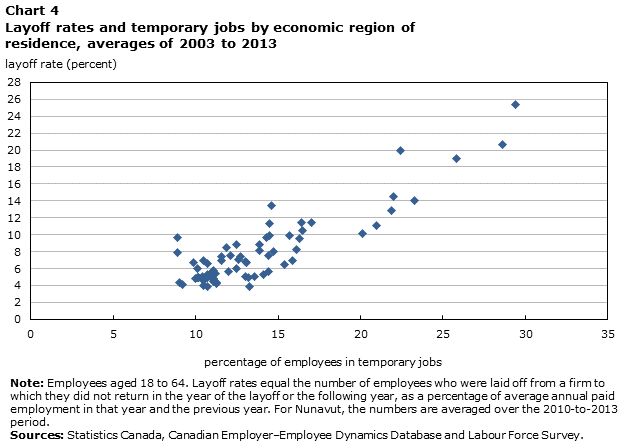
Data table for Chart 4
| Percentage of employees in temporary jobs | Layoff rate |
|---|---|
| percent | |
| 20.1 | 10.2 |
| 29.4 | 25.4 |
| 25.8 | 19.0 |
| 21.9 | 12.9 |
| 22.0 | 14.5 |
| 16.3 | 9.6 |
| 16.1 | 8.2 |
| 21.0 | 11.1 |
| 13.2 | 4.9 |
| 22.4 | 20.0 |
| 13.9 | 8.1 |
| 14.7 | 8.0 |
| 15.9 | 6.9 |
| 16.4 | 11.4 |
| 28.6 | 20.7 |
| 16.5 | 10.5 |
| 15.4 | 6.5 |
| 13.1 | 6.7 |
| 13.0 | 6.8 |
| 11.6 | 7.4 |
| 11.1 | 5.8 |
| 14.1 | 5.3 |
| 10.9 | 5.1 |
| 10.7 | 6.6 |
| 11.6 | 7.0 |
| 14.4 | 5.6 |
| 14.5 | 11.3 |
| 13.9 | 8.8 |
| 17.0 | 11.5 |
| 14.6 | 13.4 |
| 13.3 | 3.9 |
| 13.0 | 5.1 |
| 12.0 | 5.6 |
| 11.3 | 4.2 |
| 10.5 | 4.6 |
| 10.2 | 5.0 |
| 10.7 | 4.9 |
| 9.9 | 6.7 |
| 10.4 | 5.1 |
| 12.7 | 7.4 |
| 14.4 | 7.5 |
| 9.0 | 4.3 |
| 10.0 | 4.8 |
| 10.1 | 4.9 |
| 10.5 | 4.0 |
| 11.1 | 4.5 |
| 12.6 | 7.1 |
| 10.7 | 3.9 |
| 11.1 | 4.8 |
| 11.3 | 4.4 |
| 11.0 | 5.6 |
| 12.1 | 7.6 |
| 10.2 | 4.9 |
| 10.7 | 5.3 |
| 9.2 | 4.1 |
| 10.5 | 7.0 |
| 10.1 | 6.0 |
| 11.2 | 5.4 |
| 8.9 | 7.9 |
| 12.5 | 6.0 |
| 11.0 | 4.8 |
| 11.9 | 8.5 |
| 14.3 | 9.7 |
| 12.5 | 8.8 |
| 14.5 | 9.9 |
| 8.9 | 9.7 |
| 15.7 | 9.9 |
| 13.6 | 5.1 |
| 23.3 | 14.0 |
|
Note: Employees aged 18 to 64. Layoff rates equal the number of employees who were laid off from a firm to
which they did not return in the year of the layoff or the following year, as a percentage of average annual paid
employment in that year and the previous year. For Nunavut, the numbers are averaged over the 2010-to-2013
period. Sources: Statistics Canada, Canadian Employer–Employee Dynamics Database and Labour Force Survey. |
|
While regions with economies that are largely based on seasonal jobs tend to have relatively higher layoff rates, they may either have lower hiring rates―reflecting fewer employment opportunities―or higher hiring rates, as temporary jobs come to an end every year but are filled by new applicants and are renewed in the following year. Hence, ERs that average relatively high layoff rates will not necessarily display low hiring rates. This can be seen in Chart 5. For instance, the ERs of South Coast–Burin Peninsula and Notre Dame─Central Bonavista Bay, Campbellton─Miramichi, and Gaspésie─Îles-de-la-Madeleine registered average layoff rates of 20% or more but also had average hiring rates of at least 24%.
Economically dynamic regions are likely to display relatively higher hiring rates and relatively lower layoff rates, as growing demand for labour reduces the likelihood of job losses and induces firms to intensify recruitment. Chart 5 provides evidence consistent with this view. Over the 2003-to-2013 period, the ERs of Calgary and Edmonton had substantially lower layoff rates and substantially higher hiring rates than the ER of Edmunston─Woodstock, no doubt reflecting―at least in part―the impact of the oil boom on western regional economies.
Other regions displayed relatively lower hiring rates and relatively lower layoff rates because their economy is largely based on employment in public administration, a sector that typically has low rates of worker turnover. This is the case of the ERs of Ottawa and Outaouais, both of which had lower-than-average layoff rates and hiring rates during the 2003-to-2013 period.
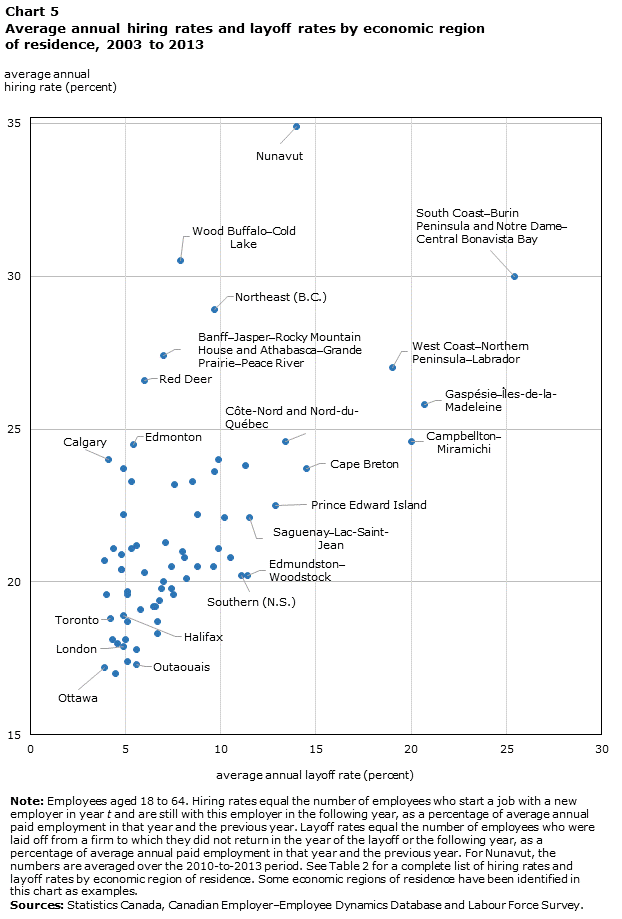
Data table for Chart 5
| Economic region name | Average annual layoff rate | Average annual hiring rate |
|---|---|---|
| percent | ||
| Avalon Peninsula | 10.2 | 22.1 |
| South Coast–Burin Peninsula and Notre Dame–Central Bonavista Bay | 25.4 | 30.0 |
| West Coast–Northern Peninsula–Labrador | 19.0 | 27.0 |
| Prince Edward Island | 12.9 | 22.5 |
| Cape Breton | 14.5 | 23.7 |
| North Shore | 9.6 | 20.5 |
| Annapolis Valley | 8.2 | 20.1 |
| Southern (N.S.) | 11.1 | 20.2 |
| Halifax | 4.9 | 18.9 |
| Campbellton–Miramichi | 20.0 | 24.6 |
| Moncton–Richibucto | 8.1 | 20.8 |
| Saint John–St. Stephen | 8.0 | 21.0 |
| Fredericton–Oromocto | 6.9 | 19.8 |
| Edmundston–Woodstock | 11.4 | 20.2 |
| Gaspésie–Îles-de-la-Madeleine | 20.7 | 25.8 |
| Bas-Saint-Laurent | 10.5 | 20.8 |
| Capitale-Nationale (Que.) | 6.5 | 19.2 |
| Chaudière-Appalaches | 6.7 | 18.7 |
| Estrie | 6.8 | 19.4 |
| Centre-du-Québec | 7.4 | 19.8 |
| Montérégie | 5.8 | 19.1 |
| Montréal | 5.3 | 21.1 |
| Laval | 5.1 | 19.7 |
| Lanaudière | 6.6 | 19.2 |
| Laurentides | 7.0 | 20.0 |
| Outaouais | 5.6 | 17.3 |
| Abitibi-Témiscamingue | 11.3 | 23.8 |
| Mauricie | 8.8 | 20.5 |
| Saguenay–Lac-Saint-Jean | 11.5 | 22.1 |
| Côte-Nord and Nord-du-Québec | 13.4 | 24.6 |
| Ottawa | 3.9 | 17.2 |
| Kingston–Pembroke | 5.1 | 18.7 |
| Muskoka–Kawarthas | 5.6 | 17.8 |
| Toronto | 4.2 | 18.8 |
| Kitchener–Waterloo–Barrie | 4.6 | 18.0 |
| Hamilton–Niagara Peninsula | 5.0 | 18.1 |
| London | 4.9 | 17.9 |
| Windsor–Sarnia | 6.7 | 18.3 |
| Stratford–Bruce Peninsula | 5.1 | 17.4 |
| Northeast (Ont.) | 7.4 | 20.5 |
| Northwest | 7.5 | 19.6 |
| Southeast | 4.3 | 18.1 |
| South Central and North Central | 4.8 | 20.4 |
| Southwest | 4.9 | 22.2 |
| Winnipeg | 4.0 | 19.6 |
| Interlake | 4.5 | 17.0 |
| Parklands and North | 7.1 | 21.3 |
| Regina–Moose Mountain | 3.9 | 20.7 |
| Swift Current–Moose Jaw | 4.8 | 20.9 |
| Saskatoon–Biggar | 4.4 | 21.1 |
| Yorkton–Melville | 5.6 | 21.2 |
| Prince Albert and Northern | 7.6 | 23.2 |
| Lethbridge–Medicine Hat | 4.9 | 23.7 |
| Camrose–Drumheller | 5.3 | 23.3 |
| Calgary | 4.1 | 24.0 |
| Banff–Jasper–Rocky Mountain House and Athabasca–Grande Prairie–Peace River | 7.0 | 27.4 |
| Red Deer | 6.0 | 26.6 |
| Edmonton | 5.4 | 24.5 |
| Wood Buffalo–Cold Lake | 7.9 | 30.5 |
| Vancouver Island and Coast | 6.0 | 20.3 |
| Lower Mainland–Southwest | 4.8 | 20.4 |
| Thompson–Okanagan | 8.5 | 23.3 |
| Kootenay | 9.7 | 23.6 |
| Cariboo | 8.8 | 22.2 |
| North Coast and Nechako | 9.9 | 21.1 |
| Northeast (B.C.) | 9.7 | 28.9 |
| Yukon Territory | 9.9 | 24.0 |
| Northwest Territories | 5.1 | 19.6 |
| Nunavut | 14.0 | 34.9 |
|
Note: Employees aged 18 to 64. Hiring rates equal the number of employees who start a job with a new employer in year t and are still with this employer in the following year, as a percentage of average annual paid employment in that year and the previous year. Layoff rates equal the number of employees who were laid off from a firm to which they did not return in the year of the layoff or the following year, as a percentage of average annual paid employment in that year and the previous year. For Nunavut, the numbers are averaged over the 2010-to-2013 period. Only the economic regions of residence that are in boldface appear on the chart because they are used as examples. Sources: Statistics Canada, Canadian Employer–Employee Dynamics Database and Labour Force Survey. |
||
Economic regions adjusted to the 2008-2009 recession mainly by reducing hiring rates
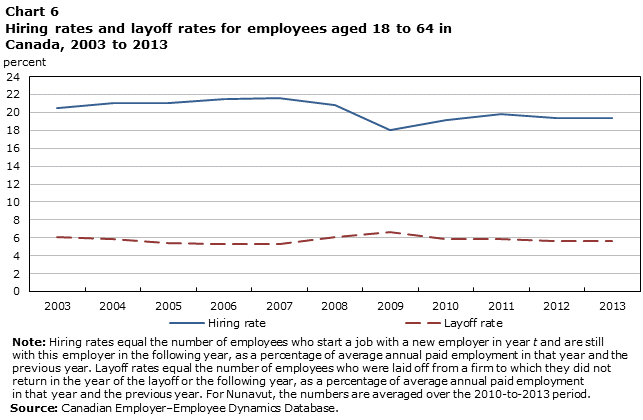
The data shown so far are averages taken over the 2003-to-2013 period and thus do not allow an assessment of whether ERs adjusted to the 2008-2009 recession mainly by reducing hiring rates or by increasing layoff rates. Chart 6 sheds light on this question. It shows that between 2007 and 2009―from expansionary to recessionary conditions―the hiring rate declined by 3.6 percentage points and the layoff rate increased by 1.3 percentage points at the national level. This suggests that in most ERs, firms adjusted to the 2008-2009 recession mainly through reduced hiring offers.
Data table for Chart 6
| Year | Hiring rate | Layoff rate |
|---|---|---|
| percent | ||
| 2003 | 20.5 | 6.1 |
| 2004 | 21.1 | 5.9 |
| 2005 | 21.1 | 5.4 |
| 2006 | 21.5 | 5.3 |
| 2007 | 21.6 | 5.3 |
| 2008 | 20.8 | 6.1 |
| 2009 | 18.0 | 6.6 |
| 2010 | 19.2 | 5.9 |
| 2011 | 19.8 | 5.9 |
| 2012 | 19.4 | 5.6 |
| 2013 | 19.4 | 5.6 |
|
Note: Hiring rates equal the number of employees who start a job with a new employer in year t and are still with this employer in the following year, as a percentage of average annual paid employment in that year and the previous year. Layoff rates equal the number of employees who were laid off from a firm to which they did not return in the year of the layoff or the following year, as a percentage of average annual paid employment in that year and the previous year. For Nunavut, the numbers are averaged over the 2010-to-2013 period. Source: Canadian Employer–Employee Dynamics Database. |
||
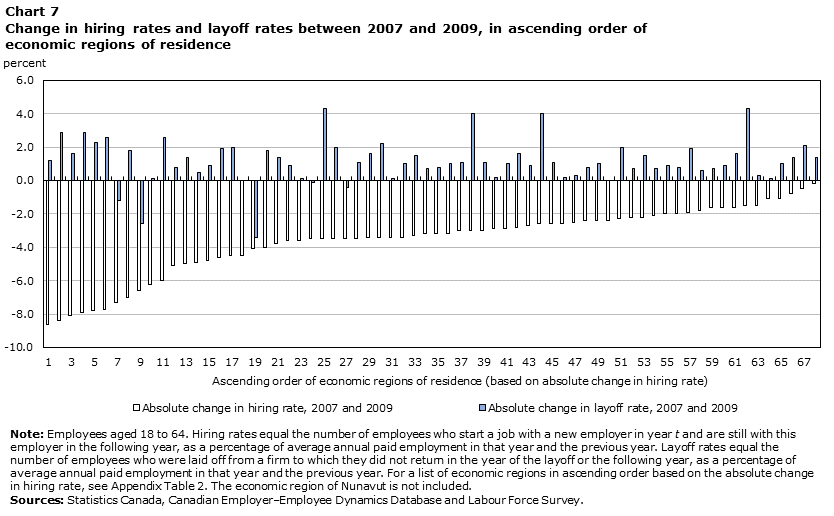
Chart 7 and Tables 4 and 5 confirm this hypothesis. They show the absolute changes in hiring rates and layoff rates within ERs between 2007 and 2009. ERs are sorted from left to right in terms of the absolute change in the hiring rate. As expected, virtually none of the ERs increased their hiring rates from 2007 to 2009. As the economy entered the recession, hiring rates fell by 8 percentage points or more in most ERs in Alberta,Note 8 from a starting point of at least 25%. Declines of 5 percentage points or more were evident in other ERs across the country, such as Thompson─Okanagan, South Central and North Central in Manitoba, Abitibi-Témiscamingue, and South Coast─Burin Peninsula and Notre Dame–Central Bonavista Bay in Newfoundland. In contrast, layoff rates within most ERs increased, in absolute terms, by less than 2 percentage points.Note 9,Note 10
Data table for Chart 7
| Ascending order of economic regions of residence (based on absolute change in hiring rate) | Absolute change in hiring rate, 2007 and 2009 | Absolute change in layoff rate, 2007 and 2009 |
|---|---|---|
| percent | ||
| 1 | -8.6 | 1.2 |
| 2 | -8.4 | 2.9 |
| 3 | -8.1 | 1.6 |
| 4 | -7.9 | 2.9 |
| 5 | -7.8 | 2.3 |
| 6 | -7.7 | 2.6 |
| 7 | -7.3 | -1.2 |
| 8 | -7.0 | 1.8 |
| 9 | -6.6 | -2.6 |
| 10 | -6.2 | 0.1 |
| 11 | -6.0 | 2.6 |
| 12 | -5.1 | 0.8 |
| 13 | -5.0 | 1.4 |
| 14 | -4.9 | 0.5 |
| 15 | -4.8 | 0.9 |
| 16 | -4.6 | 1.9 |
| 17 | -4.5 | 2.0 |
| 18 | -4.5 | 0.0 |
| 19 | -4.1 | -3.4 |
| 20 | -4.0 | 1.8 |
| 21 | -3.8 | 1.4 |
| 22 | -3.6 | 0.9 |
| 23 | -3.6 | 0.1 |
| 24 | -3.5 | -0.1 |
| 25 | -3.5 | 4.3 |
| 26 | -3.5 | 2.0 |
| 27 | -3.5 | -0.4 |
| 28 | -3.5 | 1.1 |
| 29 | -3.4 | 1.6 |
| 30 | -3.4 | 2.2 |
| 31 | -3.4 | 0.1 |
| 32 | -3.4 | 1.0 |
| 33 | -3.3 | 1.5 |
| 34 | -3.2 | 0.7 |
| 35 | -3.2 | 0.8 |
| 36 | -3.2 | 1.0 |
| 37 | -3.0 | 1.1 |
| 38 | -3.0 | 4.0 |
| 39 | -3.0 | 1.1 |
| 40 | -2.9 | 0.2 |
| 41 | -2.9 | 1.0 |
| 42 | -2.8 | 1.6 |
| 43 | -2.7 | 0.9 |
| 44 | -2.6 | 4.0 |
| 45 | -2.6 | 1.1 |
| 46 | -2.6 | 0.2 |
| 47 | -2.5 | 0.3 |
| 48 | -2.4 | 0.8 |
| 49 | -2.4 | 1.0 |
| 50 | -2.4 | 0.0 |
| 51 | -2.3 | 2.0 |
| 52 | -2.2 | 0.7 |
| 53 | -2.2 | 1.5 |
| 54 | -2.1 | 0.7 |
| 55 | -2.0 | 0.9 |
| 56 | -2.0 | 0.8 |
| 57 | -1.9 | 1.9 |
| 58 | -1.8 | 0.6 |
| 59 | -1.6 | 0.7 |
| 60 | -1.6 | 0.9 |
| 61 | -1.6 | 1.6 |
| 62 | -1.5 | 4.3 |
| 63 | -1.5 | 0.3 |
| 64 | -1.1 | 0.1 |
| 65 | -1.1 | 1.0 |
| 66 | -0.8 | 1.4 |
| 67 | -0.5 | 2.1 |
| 68 | -0.2 | 1.4 |
|
Note: Employees aged 18 to 64. Hiring rates equal the number of employees who start a job with a new employer in year t and are still with this employer in the following year, as a percentage of average annual paid employment in that year and the previous year. Layoff rates equal the number of employees who were laid off from a firm to which they did not return in the year of the layoff or the following year, as a percentage of average annual paid employment in that year and the previous year. For a list of economic regions in ascending order based on the absolute change in hiring rate, see Appendix Table 2. The economic region of Nunavut is not included. Sources: Statistics Canada, Canadian Employer–Employee Dynamics Database and Labour Force Survey. |
||
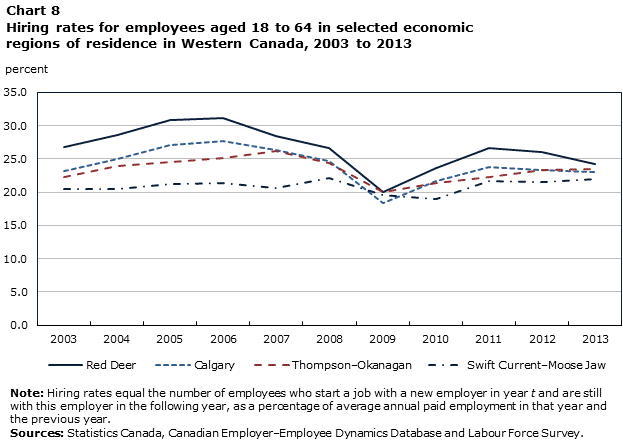
Over the 2003-to-2013 period, hiring rates varied far more over time in Western Canada than they did elsewhere. In Red Deer, for example, the hiring rate reached a high of 31% in 2006, but declined by 11 percentage points by 2009 (Chart 8). As economic growth resumed in subsequent years, the hiring rate in Red Deer rebounded by 4 to 7 percentage points. A similar pattern was evident in Calgary as well as in ERs further afield, such as Thompson–Okanagan.Note 11
Data table for Chart 8
| Economic regions of residence | 2003 | 2004 | 2005 | 2006 | 2007 | 2008 | 2009 | 2010 | 2011 | 2012 | 2013 |
|---|---|---|---|---|---|---|---|---|---|---|---|
| percent | |||||||||||
| Red Deer | 26.7 | 28.6 | 30.8 | 31.2 | 28.4 | 26.6 | 20.0 | 23.6 | 26.6 | 26.0 | 24.2 |
| Calgary | 23.1 | 25.0 | 27.0 | 27.7 | 26.3 | 24.7 | 18.3 | 21.6 | 23.7 | 23.3 | 23.0 |
| Thompson–Okanagan | 22.3 | 23.9 | 24.5 | 25.1 | 26.1 | 24.3 | 20.0 | 21.3 | 22.3 | 23.3 | 23.5 |
| Swift Current–Moose Jaw | 20.4 | 20.4 | 21.2 | 21.4 | 20.6 | 22.1 | 19.5 | 18.9 | 21.7 | 21.5 | 22.0 |
|
Note: Hiring rates equal the number of employees who start a job with a new employer in year t and are still with this employer in the following year, as a percentage of average annual paid employment in that year and the previous year. Sources: Statistics Canada, Canadian Employer–Employee Dynamics Database and Labour Force Survey. |
|||||||||||
Hiring rates in ERs in Ontario and Quebec generally varied far less than they did in Western Canada (Chart 9). In Capitale-Nationale (Quebec) and Toronto, rates were around 20% through much of the 2000s, but remained slightly below that level in the wake of the 2008-2009 recession. In southern Ontario, the hiring rate in Hamilton–Niagara Peninsula declined by about 3 percentage points between 2007 and 2009, and remained slightly lower through the 2010s (at about 18%) than it had been through the early 2000s (at 19% to 20%). In Windsor–Sarnia and Kitchener–Waterloo–Barrie, hiring rates fell by roughly 3 percentage points from 2007 to 2009. Again, hiring rates were higher in Atlantic Canada relative to other regions in Central Canada.
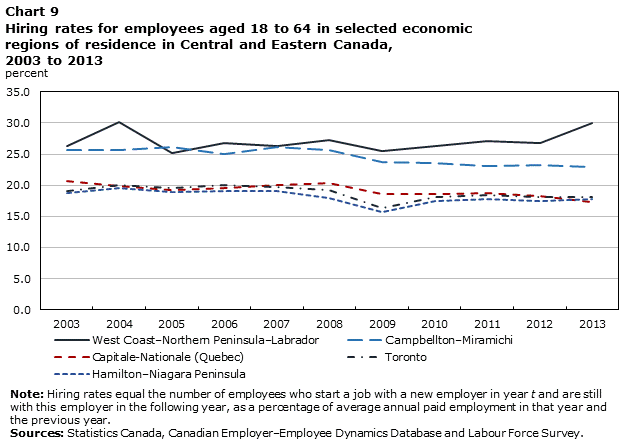
Data table for Chart 9
| Economic regions of residence | 2003 | 2004 | 2005 | 2006 | 2007 | 2008 | 2009 | 2010 | 2011 | 2012 | 2013 |
|---|---|---|---|---|---|---|---|---|---|---|---|
| percent | |||||||||||
| West Coast–Northern Peninsula–Labrador | 26.3 | 30.2 | 25.1 | 26.7 | 26.3 | 27.3 | 25.5 | 26.3 | 27.1 | 26.8 | 30.0 |
| Campbellton–Miramichi | 25.6 | 25.7 | 26.2 | 25.0 | 26.2 | 25.7 | 23.8 | 23.6 | 23.1 | 23.2 | 22.9 |
| Capitale-Nationale (Quebec) | 20.7 | 19.8 | 19.2 | 19.5 | 20.1 | 20.3 | 18.6 | 18.5 | 18.7 | 18.2 | 17.3 |
| Toronto | 19.1 | 20.1 | 19.6 | 20.0 | 19.7 | 19.2 | 16.4 | 18.1 | 18.4 | 18.1 | 18.1 |
| Hamilton–Niagara Peninsula | 18.7 | 19.6 | 18.9 | 19.1 | 19.1 | 17.9 | 15.7 | 17.4 | 17.7 | 17.5 | 17.7 |
|
Note: Hiring rates equal the number of employees who start a job with a new employer in year t and are still with this employer in the following year, as a percentage of average annual paid employment in that year and the previous year. Sources: Statistics Canada, Canadian Employer–Employee Dynamics Database and Labour Force Survey. |
|||||||||||
Like hiring rates, layoff rates evolved differently across ERs during the 2008-2009 recession. From 2007 to 2009, layoff rates increased by less than 1 percentage point in the ERs of Montréal and Ottawa (Chart 10). In contrast, they increased by 2.9 and 2.5 percentage points, respectively, in the ERs of Calgary and Edmonton. The ERs of Halifax, Toronto and Vancouver Island and Coast registered increases in layoff rates that varied between 1.4 and 2.0 percentage points.
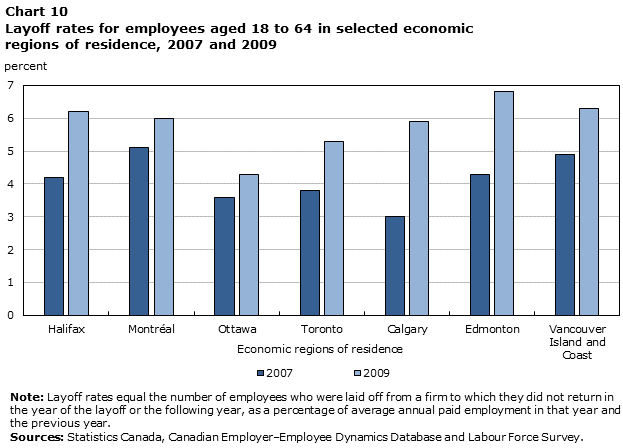
Data table for Chart 10
| Economic regions of residence | 2007 | 2009 |
|---|---|---|
| percent | ||
| Halifax | 4.2 | 6.2 |
| Montréal | 5.1 | 6.0 |
| Ottawa | 3.6 | 4.3 |
| Toronto | 3.8 | 5.3 |
| Calgary | 3.0 | 5.9 |
| Edmonton | 4.3 | 6.8 |
| Vancouver Island and Coast | 4.9 | 6.3 |
|
Note: Layoff rates equal the number of employees who were laid off from a firm to which they did not return in the
year of the layoff or the following year, as a percentage of average annual paid employment in that year and the previous year. Sources: Statistics Canada, Canadian Employer–Employee Dynamics Database and Labour Force Survey. |
||
Summary
Regardless of general economic conditions, a large amount of worker reallocation takes place each year. To quantify key elements of such worker reallocation, administrative data have been used to produce experimental estimates of hiring and layoff rates at a fairly detailed level of geographic disaggregation over the 2003-to-2013 period.
The study uncovered several key patterns. First, hires and layoffs are sizeable relative to net employment growth. This is true both in expansionary periods as well as during recessions. Second, regions that display relatively higher layoff rates tend to be small and have a high proportion of employees involved in temporary jobs, some of which are seasonal jobs in agriculture, forestry, fishing, and hunting. In fact, the proportion of employees involved in temporary jobs was, over the 2003-to-2013 period, a fairly good predictor of the average layoff rates experienced by economic regions (ERs) during that period. Third, regions that have relatively higher layoff rates do not necessarily have lower hiring rates. Fourth, while firms in most ERs adjusted to the 2008-2009 recession by reducing hiring and increasing layoffs, decreases in hiring rates were quantitatively more important than increases in layoff rates. Hiring rates followed different temporal patterns across ERs, dropping substantially in several western regions while changing fairly little in several regions of the Atlantic Provinces. Layoff rates also evolved differently across regions. They increased to a greater extent in the ERs of Calgary and Edmonton than they did in the ERs of Montréal, Ottawa, and Toronto.
| Year | Employees aged 18 to 64 | Employees aged 25 to 54 | ||||
|---|---|---|---|---|---|---|
| Number of employees in January | Hires | Layoffs | Number of employees in January | Hires | Layoffs | |
| thousands | ||||||
| 2003 | 12,362 | 2,583 | 769 | 9,368 | 1,554 | 505 |
| 2004 | 12,585 | 2,717 | 755 | 9,504 | 1,633 | 491 |
| 2005 | 12,770 | 2,749 | 703 | 9,543 | 1,648 | 454 |
| 2006 | 12,849 | 2,840 | 705 | 9,563 | 1,699 | 452 |
| 2007 | 13,185 | 2,897 | 710 | 9,757 | 1,732 | 454 |
| 2008 | 13,399 | 2,834 | 829 | 9,818 | 1,706 | 529 |
| 2009 | 13,210 | 2,437 | 902 | 9,671 | 1,460 | 581 |
| 2010 | 13,211 | 2,604 | 800 | 9,658 | 1,559 | 500 |
| 2011 | 13,555 | 2,730 | 808 | 9,831 | 1,632 | 493 |
| 2012 | 13,674 | 2,729 | 789 | 9,872 | 1,629 | 481 |
| 2013 | 13,973 | 2,755 | 798 | 10,010 | 1,640 | 485 |
| Note: The number of employees in January is obtained from the Labour Force Survey. Hires equal the number of employees who start a job with a new employer in year t and are still with this employer in the following year. Layoffs equal the number of employees who were laid off from one firm to which they did not return in the year of the layoff or the following year. Sources: Statistics Canada, Canadian Employer–Employee Dynamics Database and Labour Force Survey. |
||||||
| Hiring rates | Layoff rates | |||
|---|---|---|---|---|
| Individuals aged 18 to 64 | Individuals aged 25 to 54 | Individuals aged 18 to 64 | Individuals aged 25 to 54 | |
| percent | ||||
| Canada | 20.2 | 16.6 | 5.8 | 5.0 |
| Newfoundland and Labrador | 25.0 | 20.5 | 15.7 | 13.2 |
| Avalon Peninsula | 22.1 | 17.9 | 10.2 | 8.7 |
| South Coast–Burin Peninsula and Notre Dame–Central Bonavista Bay | 30.0 | 25.1 | 25.4 | 21.5 |
| West Coast–Northern Peninsula–Labrador | 27.0 | 22.1 | 19.0 | 15.6 |
| Prince Edward Island | 22.5 | 18.0 | 12.9 | 10.8 |
| Nova Scotia | 20.1 | 16.2 | 8.0 | 6.9 |
| Cape Breton | 23.7 | 19.1 | 14.5 | 12.6 |
| North Shore | 20.5 | 16.3 | 9.6 | 8.3 |
| Annapolis Valley | 20.1 | 16.2 | 8.2 | 7.1 |
| Southern | 20.2 | 16.2 | 11.1 | 9.6 |
| Halifax | 18.9 | 15.4 | 4.9 | 4.3 |
| New Brunswick | 21.3 | 17.1 | 10.4 | 8.9 |
| Campbellton–Miramichi | 24.6 | 19.9 | 20.0 | 17.0 |
| Moncton–Richibucto | 20.8 | 16.9 | 8.1 | 6.8 |
| Saint John–St. Stephen | 21.0 | 16.7 | 8.0 | 6.8 |
| Fredericton–Oromocto | 19.8 | 15.9 | 6.9 | 5.8 |
| Edmundston–Woodstock | 20.2 | 15.9 | 11.4 | 9.4 |
| Quebec | 20.0 | 16.1 | 6.7 | 5.7 |
| Gaspésie–Îles-de-la-Madeleine | 25.8 | 20.6 | 20.7 | 17.2 |
| Bas-Saint-Laurent | 20.8 | 15.8 | 10.5 | 8.7 |
| Capitale-Nationale | 19.2 | 15.2 | 6.5 | 5.4 |
| Chaudière-Appalaches | 18.7 | 14.0 | 6.7 | 5.3 |
| Estrie | 19.4 | 15.0 | 6.8 | 5.6 |
| Centre-du-Québec | 19.8 | 15.2 | 7.4 | 5.9 |
| Montérégie | 19.1 | 14.9 | 5.8 | 4.8 |
| Montréal | 21.1 | 18.7 | 5.3 | 5.0 |
| Laval | 19.7 | 15.7 | 5.1 | 4.3 |
| Lanaudière | 19.2 | 14.7 | 6.6 | 5.5 |
| Laurentides | 20.0 | 15.6 | 7.0 | 5.8 |
| Outaouais | 17.3 | 13.1 | 5.6 | 4.6 |
| Abitibi-Témiscamingue | 23.8 | 18.5 | 11.3 | 9.2 |
| Mauricie | 20.5 | 15.8 | 8.8 | 7.3 |
| Saguenay–Lac-Saint-Jean | 22.1 | 16.6 | 11.5 | 9.4 |
| Côte-Nord and Nord-du-Québec | 24.6 | 19.3 | 13.4 | 11.3 |
| Ontario | 18.4 | 15.0 | 4.7 | 4.2 |
| Ottawa | 17.2 | 13.4 | 3.9 | 3.3 |
| Kingston–Pembroke | 18.7 | 14.5 | 5.1 | 4.3 |
| Muskoka–Kawarthas | 17.8 | 13.5 | 5.6 | 4.8 |
| Toronto | 18.8 | 16.1 | 4.2 | 3.9 |
| Kitchener–Waterloo–Barrie | 18.0 | 14.1 | 4.6 | 3.9 |
| Hamilton–Niagara Peninsula | 18.1 | 14.3 | 5.0 | 4.3 |
| London | 17.9 | 13.9 | 4.9 | 4.1 |
| Windsor–Sarnia | 18.3 | 14.2 | 6.7 | 5.9 |
| Stratford–Bruce Peninsula | 17.4 | 12.9 | 5.1 | 4.1 |
| Northeast | 20.5 | 15.8 | 7.4 | 6.1 |
| Northwest | 19.6 | 15.3 | 7.5 | 6.4 |
| Note: Hiring rates equal the number of employees who start a job with a new employer in year t and are still with this new employer in the following year, as a percentage of average annual paid employment in year t and the previous year. Layoff rates equal the number of employees who were laid off from an employer to which they did not return in the year of the layoff or the following year, as a percentage of average annual paid employment in year t and the previous year. The numbers shown are averages over the 2003-to-2013 period except for Nunavut, where averages are over the 2010-to-2013 period. Sources: Statistics Canada, Canadian Employer–Employee Dynamics Database and Labour Force Survey. |
||||
| Hiring rates | Layoff rates | |||
|---|---|---|---|---|
| Individuals aged 18 to 64 | Individuals aged 25 to 54 | Individuals aged 18 to 64 | Individuals aged 25 to 54 | |
| percent | ||||
| Manitoba | 19.7 | 15.9 | 4.4 | 3.7 |
| Southeast | 18.1 | 13.5 | 4.3 | 3.3 |
| South Central and North Central | 20.4 | 15.3 | 4.8 | 3.5 |
| Southwest | 22.2 | 17.5 | 4.9 | 3.7 |
| Winnipeg | 19.6 | 16.3 | 4.0 | 3.5 |
| Interlake | 17.0 | 12.2 | 4.5 | 3.3 |
| Parklands and North | 21.3 | 17.0 | 7.1 | 5.9 |
| Saskatchewan | 21.4 | 16.9 | 4.9 | 4.1 |
| Regina–Moose Mountain | 20.7 | 16.5 | 3.9 | 3.3 |
| Swift Current–Moose Jaw | 20.9 | 15.9 | 4.8 | 3.7 |
| Saskatoon–Biggar | 21.1 | 16.9 | 4.4 | 3.7 |
| Yorkton–Melville | 21.2 | 15.9 | 5.6 | 4.4 |
| Prince Albert and Northern | 23.2 | 18.2 | 7.6 | 6.4 |
| Alberta | 24.8 | 21.3 | 5.1 | 4.5 |
| Lethbridge–Medicine Hat | 23.7 | 19.4 | 4.9 | 4.1 |
| Camrose–Drumheller | 23.3 | 18.7 | 5.3 | 4.4 |
| Calgary | 24.0 | 20.9 | 4.1 | 3.6 |
| Banff–Jasper–Rocky Mountain House and Athabasca–Grande Prairie–Peace River | 27.4 | 23.0 | 7.0 | 6.0 |
| Red Deer | 26.6 | 22.7 | 6.0 | 5.3 |
| Edmonton | 24.5 | 21.3 | 5.4 | 5.0 |
| Wood Buffalo–Cold Lake | 30.5 | 26.3 | 7.9 | 7.0 |
| British Columbia | 21.0 | 17.6 | 5.9 | 5.2 |
| Vancouver Island and Coast | 20.3 | 16.7 | 6.0 | 5.3 |
| Lower Mainland–Southwest | 20.4 | 17.3 | 4.8 | 4.3 |
| Thompson–Okanagan | 23.3 | 18.9 | 8.5 | 7.2 |
| Kootenay | 23.6 | 19.6 | 9.7 | 8.4 |
| Cariboo | 22.2 | 18.4 | 8.8 | 7.7 |
| North Coast and Nechako | 21.1 | 17.5 | 9.9 | 8.8 |
| Northeast | 28.9 | 24.8 | 9.7 | 8.5 |
| Yukon | 24.0 | 20.6 | 9.9 | 8.6 |
| Northwest Territories | 19.6 | 16.8 | 5.1 | 4.4 |
| Nunavut | 34.9 | 29.7 | 14.0 | 12.8 |
| Note: Hiring rates equal the number of employees who start a job with a new employer in year t and are still with this new employer in the following year, as a percentage of average annual paid employment in year t and the previous year. Layoff rates equal the number of employees who were laid-off from an employer to which they did not return in the year of the layoff or the following year, as a percentage of average annual paid employment in year t and the previous year. The numbers shown are averages over the 2003-to-2013 period except for Nunavut, where averages are over the 2010-to-2013 period. Sources: Statistics Canada, Canadian Employer–Employee Dynamics Database and Labour Force Survey. |
||||
| Tercile | |||
|---|---|---|---|
| Lower | Middle | Upper | |
| number | |||
| Economic regions | 23 | 23 | 23 |
| thousands | |||
| Average number of employees aged 18 to 64 | 360 | 171 | 59 |
| percent | |||
| Layoff rate | 4.7 | 6.8 | 12.6 |
| Hiring rate | 19.9 | 21.1 | 23.8 |
| Percentage of employees | |||
| With 24 months of tenure or less | 32.9 | 32.1 | 33.9 |
| Aged 18 to 34 years | 38.7 | 37.5 | 33.9 |
| Aged 50 to 64 years | 24.2 | 25.0 | 27.2 |
| In agriculture, fishing, forestry and hunting | 1.7 | 1.8 | 3.4 |
| In accommodation and food services | 5.9 | 6.1 | 6.6 |
| In construction | 5.5 | 6.2 | 6.1 |
| In manufacturing | 12.1 | 12.4 | 11.7 |
| In small firms | 19.7 | 20.4 | 24.5 |
| In large firms | 49.0 | 48.6 | 44.2 |
| In full-time jobs | 84.4 | 84.6 | 84.7 |
| In temporary jobs | 11.1 | 12.3 | 18.0 |
| In term or contract jobs | 5.7 | 6.0 | 7.0 |
| In seasonal jobs | 2.6 | 3.3 | 6.8 |
| 2014 dollars | |||
| Earnings and Employment Insurance benefits of employees | |||
| Average annual wages per job held by employees | 31,773 | 29,931 | 26,023 |
| Average annual wages per employee | 45,260 | 43,064 | 37,602 |
| Average Employment Insurance income received by employees | 790 | 1,117 | 2,167 |
| Note: Employees aged 18 to 64. Small firms have less than 20 employees. Large firms have 500 employees or more. Full-time jobs involve 30 hours of work per week or more. Numbers are averaged over the 2003-to-2013 period except for Nunavut, where they are averaged over the 2010-to-2013 period. Economic regions in the lower (upper) tier consist of those 23 economic regions that averaged the lowest (highest) layoff rates over the 2003-to-2013 period. Wages and Employment Insurance income are expressed in 2014 dollars, using province-specific values of the Consumer Price Index (All Items). Information on the number of employees aged 18 to 64 and on the percentage of employees with specific characteristics or jobs is drawn from the Labour Force Survey. Information on layoff rates, hiring rates, earnings and Employment Insurance benefits of employees is drawn from the Canadian Employer–Employee Dynamics Database. Sources: Statistics Canada, Canadian Employer–Employee Dynamics Database and Labour Force Survey. |
|||
| 2003 | 2004 | 2005 | 2006 | 2007 | 2008 | 2009 | 2010 | 2011 | 2012 | 2013 | |
|---|---|---|---|---|---|---|---|---|---|---|---|
| percent | |||||||||||
| Canada | 20.5 | 21.1 | 21.1 | 21.5 | 21.6 | 20.8 | 18.0 | 19.2 | 19.8 | 19.4 | 19.4 |
| Newfoundland and Labrador | 24.2 | 25.9 | 23.5 | 26.1 | 27.6 | 26.7 | 23.2 | 23.3 | 24.4 | 23.8 | 26.2 |
| Avalon Peninsula | 21.5 | 21.3 | 21.4 | 22.8 | 25.6 | 23.6 | 21.1 | 20.2 | 21.5 | 21.1 | 22.8 |
| South Coast–Burin Peninsula and Notre Dame–Central Bonavista Bay | 28.2 | 32.1 | 26.7 | 32.6 | 33.1 | 33.1 | 26.4 | 28.5 | 29.5 | 28.4 | 31.7 |
| West Coast–Northern Peninsula–Labrador | 26.3 | 30.2 | 25.1 | 26.7 | 26.3 | 27.3 | 25.5 | 26.3 | 27.1 | 26.8 | 30.0 |
| Prince Edward Island | |||||||||||
| Prince Edward Island | 26.9 | 22.6 | 23.7 | 24.3 | 24.2 | 22.8 | 20.7 | 21.8 | 20.9 | 19.6 | 20.0 |
| Nova Scotia | 21.1 | 20.9 | 20.7 | 20.9 | 21.5 | 20.7 | 18.4 | 21.1 | 18.6 | 18.4 | 18.2 |
| Cape Breton | 25.7 | 23.6 | 24.9 | 24.6 | 26.1 | 24.0 | 23.2 | 22.6 | 22.2 | 21.9 | 21.7 |
| North Shore | 22.2 | 21.7 | 21.0 | 21.5 | 22.4 | 21.6 | 19.0 | 20.5 | 19.2 | 18.4 | 18.1 |
| Annapolis Valley | 20.9 | 21.2 | 20.2 | 20.4 | 20.4 | 20.0 | 18.8 | 20.4 | 20.1 | 19.7 | 18.8 |
| Southern | 20.5 | 21.3 | 20.2 | 22.2 | 21.6 | 20.5 | 19.0 | 20.1 | 18.3 | 18.3 | 20.1 |
| Halifax | 19.7 | 19.6 | 19.8 | 19.5 | 20.2 | 19.7 | 16.7 | 21.3 | 17.3 | 17.3 | 16.9 |
| New Brunswick | 22.6 | 22.2 | 22.4 | 22.6 | 23.2 | 23.0 | 19.9 | 20.0 | 19.8 | 19.2 | 19.4 |
| Campbellton–Miramichi | 25.6 | 25.7 | 26.2 | 25.0 | 26.2 | 25.7 | 23.8 | 23.6 | 23.1 | 23.2 | 22.9 |
| Moncton–Richibucto | 22.1 | 21.1 | 21.6 | 22.0 | 22.9 | 22.9 | 19.4 | 20.2 | 19.9 | 18.5 | 18.5 |
| Saint John–St. Stephen | 22.7 | 21.2 | 21.7 | 23.0 | 23.5 | 23.8 | 19.7 | 19.4 | 18.9 | 17.8 | 18.8 |
| Fredericton–Oromocto | 21.6 | 21.1 | 21.2 | 21.7 | 21.3 | 20.6 | 18.0 | 18.0 | 17.9 | 17.9 | 18.8 |
| Edmundston–Woodstock | 20.3 | 22.8 | 20.7 | 21.0 | 21.3 | 20.8 | 18.4 | 18.7 | 19.3 | 19.8 | 18.7 |
| Quebec | 20.9 | 20.9 | 20.4 | 20.5 | 21.1 | 20.5 | 18.8 | 19.3 | 19.9 | 19.2 | 18.6 |
| Gaspésie–Îles-de-la-Madeleine | 25.9 | 27.6 | 26.5 | 28.4 | 29.7 | 25.9 | 25.7 | 24.5 | 24.3 | 23.3 | 22.0 |
| Bas-Saint-Laurent | 23.8 | 21.5 | 20.1 | 20.2 | 21.3 | 20.8 | 20.2 | 20.5 | 21.6 | 20.0 | 18.8 |
| Capitale-Nationale | 20.7 | 19.8 | 19.2 | 19.5 | 20.1 | 20.3 | 18.6 | 18.5 | 18.7 | 18.2 | 17.3 |
| Chaudière-Appalaches | 19.5 | 19.9 | 18.5 | 18.7 | 19.7 | 19.9 | 18.0 | 18.5 | 18.1 | 17.3 | 17.1 |
| Estrie | 20.0 | 19.8 | 19.5 | 19.9 | 21.4 | 19.7 | 17.8 | 18.4 | 18.8 | 19.1 | 19.0 |
| Centre-du-Québec | 21.8 | 20.5 | 19.3 | 18.9 | 20.9 | 19.6 | 17.8 | 19.4 | 19.9 | 20.3 | 19.5 |
| Montérégie | 19.2 | 19.8 | 19.8 | 19.9 | 20.2 | 19.4 | 18.0 | 18.4 | 19.1 | 18.3 | 17.8 |
| Montréal | 21.7 | 22.1 | 21.8 | 21.6 | 21.5 | 21.3 | 19.5 | 20.3 | 21.0 | 20.8 | 20.2 |
| Laval | 20.5 | 20.9 | 20.5 | 20.3 | 20.2 | 19.5 | 18.6 | 19.3 | 20.4 | 19.2 | 17.8 |
| Lanaudière | 19.7 | 20.3 | 19.7 | 19.8 | 20.8 | 19.8 | 18.2 | 18.1 | 18.0 | 18.1 | 18.2 |
| Laurentides | 21.6 | 21.0 | 20.5 | 20.5 | 21.5 | 20.5 | 18.8 | 19.3 | 19.9 | 19.0 | 18.0 |
| Outaouais | 19.2 | 18.0 | 17.7 | 18.5 | 19.3 | 18.5 | 16.8 | 15.9 | 16.1 | 15.2 | 15.3 |
| Abitibi-Témiscamingue | 23.7 | 24.3 | 23.5 | 23.7 | 27.6 | 23.9 | 21.4 | 24.6 | 24.1 | 24.2 | 21.1 |
| Mauricie | 21.6 | 20.7 | 20.5 | 21.3 | 22.4 | 20.8 | 18.8 | 19.6 | 20.2 | 19.7 | 19.7 |
| Saguenay–Lac-Saint-Jean | 23.3 | 23.0 | 22.2 | 22.3 | 23.2 | 22.1 | 20.3 | 22.0 | 24.6 | 20.9 | 19.4 |
| Côte-Nord and Nord-du-Québec | 24.9 | 24.7 | 22.7 | 22.3 | 25.5 | 25.7 | 25.0 | 25.4 | 26.8 | 24.6 | 22.9 |
| Ontario | 19.1 | 19.6 | 19.2 | 19.3 | 19.3 | 18.7 | 16.3 | 17.9 | 18.0 | 17.6 | 17.7 |
| Ottawa | 18.1 | 17.9 | 18.2 | 18.4 | 18.0 | 18.4 | 16.4 | 16.8 | 16.0 | 15.2 | 15.5 |
| Kingston–Pembroke | 20.6 | 20.8 | 20.0 | 19.7 | 19.2 | 19.0 | 16.1 | 17.4 | 17.2 | 17.4 | 17.8 |
| Muskoka–Kawarthas | 19.7 | 18.8 | 18.8 | 18.5 | 17.8 | 17.6 | 16.2 | 17.3 | 17.1 | 16.7 | 17.1 |
| Toronto | 19.1 | 20.1 | 19.6 | 20.0 | 19.7 | 19.2 | 16.4 | 18.1 | 18.4 | 18.1 | 18.1 |
| Kitchener–Waterloo–Barrie | 19.5 | 19.6 | 18.7 | 18.3 | 18.5 | 18.1 | 15.7 | 17.9 | 17.7 | 17.2 | 17.2 |
| Hamilton–Niagara Peninsula | 18.7 | 19.6 | 18.9 | 19.1 | 19.1 | 17.9 | 15.7 | 17.4 | 17.7 | 17.5 | 17.7 |
| Sources: Statistics Canada, Canadian Employer–Employee Dynamics Database and Labour Force Survey. | |||||||||||
| 2003 | 2004 | 2005 | 2006 | 2007 | 2008 | 2009 | 2010 | 2011 | 2012 | 2013 | |
|---|---|---|---|---|---|---|---|---|---|---|---|
| percent | |||||||||||
| Ontario (continued) | |||||||||||
| London | 19.2 | 19.7 | 18.5 | 18.2 | 18.1 | 17.0 | 15.9 | 18.0 | 17.7 | 17.4 | 17.6 |
| Windsor–Sarnia | 19.3 | 18.6 | 18.6 | 17.7 | 19.2 | 17.5 | 16.6 | 18.5 | 18.8 | 17.9 | 18.3 |
| Stratford–Bruce Peninsula | 17.4 | 16.9 | 16.9 | 18.0 | 17.8 | 18.7 | 15.6 | 17.2 | 17.4 | 16.9 | 18.2 |
| Northeast | 20.5 | 21.6 | 22.4 | 21.5 | 22.0 | 20.3 | 18.0 | 20.0 | 20.5 | 19.6 | 18.8 |
| Northwest | 18.6 | 19.0 | 18.5 | 20.1 | 21.8 | 19.8 | 18.4 | 19.2 | 21.7 | 19.5 | 18.8 |
| Manitoba | 20.2 | 20.2 | 20.0 | 21.3 | 21.1 | 20.4 | 18.1 | 18.3 | 19.3 | 18.9 | 18.9 |
| Southeast | 17.4 | 17.7 | 17.1 | 18.4 | 20.3 | 19.7 | 17.8 | 17.4 | 17.6 | 18.7 | 17.7 |
| South Central and North Central | 20.6 | 20.9 | 19.8 | 25.4 | 22.8 | 21.4 | 17.7 | 18.0 | 20.1 | 18.9 | 18.8 |
| Southwest | 21.6 | 23.3 | 23.6 | 24.2 | 24.0 | 23.0 | 20.8 | 20.5 | 21.4 | 21.5 | 19.9 |
| Winnipeg | 20.0 | 20.1 | 20.0 | 21.1 | 21.0 | 20.3 | 17.9 | 18.2 | 19.5 | 18.9 | 19.1 |
| Interlake | 20.4 | 19.6 | 17.5 | 17.8 | 17.1 | 17.0 | 15.1 | 15.0 | 16.1 | 15.2 | 15.8 |
| Parklands and North | 22.1 | 20.6 | 22.5 | 22.1 | 22.5 | 22.2 | 20.1 | 20.6 | 20.5 | 20.3 | 20.8 |
| Saskatchewan | 20.3 | 20.4 | 21.0 | 22.4 | 22.4 | 23.0 | 19.6 | 19.8 | 21.8 | 22.1 | 21.9 |
| Regina–Moose Mountain | 18.9 | 19.1 | 19.4 | 21.6 | 21.8 | 23.0 | 19.8 | 19.7 | 21.7 | 21.6 | 21.6 |
| Swift Current–Moose Jaw | 20.4 | 20.4 | 21.2 | 21.4 | 20.6 | 22.1 | 19.5 | 18.9 | 21.7 | 21.5 | 22.0 |
| Saskatoon–Biggar | 19.7 | 20.3 | 21.1 | 22.0 | 22.3 | 22.6 | 18.8 | 19.4 | 21.5 | 22.7 | 21.5 |
| Yorkton–Melville | 22.0 | 21.2 | 20.2 | 20.7 | 20.5 | 22.1 | 20.4 | 20.2 | 21.4 | 22.2 | 22.4 |
| Prince Albert and Northern | 23.3 | 22.6 | 24.1 | 25.8 | 25.5 | 24.5 | 20.6 | 21.0 | 22.7 | 22.3 | 23.2 |
| Alberta | 23.9 | 25.7 | 27.5 | 28.4 | 27.1 | 25.7 | 19.5 | 22.1 | 24.2 | 24.2 | 24.0 |
| Lethbridge–Medicine Hat | 24.5 | 25.0 | 25.3 | 25.6 | 25.3 | 25.0 | 20.8 | 20.6 | 22.5 | 21.9 | 24.2 |
| Camrose–Drumheller | 23.3 | 25.1 | 26.6 | 26.5 | 25.4 | 22.7 | 17.3 | 20.0 | 22.6 | 23.3 | 23.8 |
| Calgary | 23.1 | 25.0 | 27.0 | 27.7 | 26.3 | 24.7 | 18.3 | 21.6 | 23.7 | 23.3 | 23.0 |
| Banff–Jasper–Rocky Mountain House and Athabasca–Grande Prairie–Peace River | 27.8 | 30.1 | 31.1 | 30.5 | 28.3 | 27.6 | 20.5 | 24.0 | 25.9 | 27.3 | 28.1 |
| Red Deer | 26.7 | 28.6 | 30.8 | 31.2 | 28.4 | 26.6 | 20.0 | 23.6 | 26.6 | 26.0 | 24.2 |
| Edmonton | 23.0 | 24.9 | 26.6 | 28.2 | 27.4 | 25.9 | 19.7 | 21.9 | 24.0 | 24.2 | 23.8 |
| Wood Buffalo–Cold Lake | 27.4 | 28.7 | 33.7 | 37.4 | 35.4 | 33.8 | 26.7 | 28.2 | 27.6 | 29.2 | 27.5 |
| British Columbia | 19.8 | 22.1 | 22.7 | 23.4 | 23.3 | 21.9 | 18.4 | 19.2 | 19.9 | 20.1 | 20.4 |
| Vancouver Island and Coast | 20.5 | 21.8 | 21.7 | 22.3 | 22.3 | 20.5 | 17.3 | 17.9 | 18.9 | 19.8 | 19.8 |
| Lower Mainland–Southwest | 19.0 | 21.3 | 22.0 | 22.8 | 22.9 | 21.4 | 18.3 | 18.8 | 19.3 | 19.1 | 19.7 |
| Thompson–Okanagan | 22.3 | 23.9 | 24.5 | 25.1 | 26.1 | 24.3 | 20.0 | 21.3 | 22.3 | 23.3 | 23.5 |
| Kootenay | 23.6 | 27.8 | 26.9 | 27.8 | 24.2 | 23.0 | 19.4 | 22.0 | 22.0 | 22.4 | 20.7 |
| Cariboo | 19.9 | 24.0 | 24.8 | 24.1 | 21.6 | 23.9 | 18.6 | 21.1 | 22.0 | 21.5 | 22.3 |
| North Coast and Nechako | 18.6 | 20.6 | 22.5 | 22.8 | 23.2 | 22.5 | 15.9 | 17.5 | 21.5 | 22.7 | 24.7 |
| Northeast | 25.1 | 28.8 | 32.9 | 35.2 | 30.3 | 30.9 | 23.4 | 27.1 | 29.2 | 28.8 | 26.0 |
| Yukon (Territory) | |||||||||||
| Yukon Territory | 24.9 | 24.5 | 24.5 | 25.2 | 26.7 | 24.5 | 23.2 | 23.6 | 24.3 | 22.2 | 20.5 |
| Northwest Territories | |||||||||||
| Northwest Territories | 22.4 | 21.0 | 20.1 | 21.1 | 20.5 | 19.6 | 18.6 | 19.4 | 17.9 | 17.0 | 18.1 |
| Nunavut | |||||||||||
| Nunavut | Note ...: not applicable | Note ...: not applicable | Note ...: not applicable | Note ...: not applicable | Note ...: not applicable | Note ...: not applicable | Note ...: not applicable | 36.4 | 37.0 | 35.4 | 31.0 |
| ... not applicable Sources: Statistics Canada, Canadian Employer–Employee Dynamics Database and Labour Force Survey. |
|||||||||||
| 2003 | 2004 | 2005 | 2006 | 2007 | 2008 | 2009 | 2010 | 2011 | 2012 | 2013 | |
|---|---|---|---|---|---|---|---|---|---|---|---|
| percent | |||||||||||
| Canada | 6.1 | 5.9 | 5.4 | 5.3 | 5.3 | 6.1 | 6.6 | 5.9 | 5.9 | 5.6 | 5.6 |
| Newfoundland and Labrador | 16.6 | 18.4 | 17.3 | 16.1 | 16.3 | 15.5 | 15.8 | 14.4 | 14.9 | 13.3 | 13.4 |
| Avalon Peninsula | 11.0 | 11.2 | 11.5 | 10.7 | 10.4 | 10.4 | 10.4 | 9.5 | 9.5 | 8.3 | 9.2 |
| South Coast–Burin Peninsula and Notre Dame–Central Bonavista Bay | 25.2 | 31.2 | 26.0 | 25.4 | 28.4 | 25.1 | 25.8 | 22.8 | 24.9 | 22.9 | 21.8 |
| West Coast–Northern Peninsula–Labrador | 20.8 | 21.7 | 21.9 | 18.9 | 17.9 | 17.9 | 19.3 | 18.5 | 18.9 | 17.1 | 16.3 |
| Prince Edward Island | |||||||||||
| Prince Edward Island | 15.3 | 14.6 | 12.8 | 12.5 | 11.5 | 11.7 | 15.8 | 13.8 | 11.9 | 11.3 | 11.0 |
| Nova Scotia | 8.8 | 8.4 | 8.0 | 7.6 | 7.4 | 7.8 | 9.8 | 7.8 | 7.7 | 7.4 | 7.1 |
| Cape Breton | 15.8 | 16.4 | 14.9 | 14.6 | 13.7 | 14.3 | 14.8 | 14.5 | 13.6 | 13.4 | 13.8 |
| North Shore | 10.8 | 10.3 | 9.5 | 9.1 | 9.7 | 8.9 | 11.9 | 9.5 | 9.2 | 8.7 | 8.0 |
| Annapolis Valley | 8.7 | 8.2 | 7.5 | 7.4 | 7.3 | 7.0 | 11.6 | 8.7 | 9.2 | 7.9 | 6.9 |
| Southern | 12.2 | 11.0 | 11.0 | 11.0 | 10.4 | 11.1 | 14.4 | 10.4 | 10.7 | 10.1 | 10.2 |
| Halifax | 5.3 | 5.0 | 4.9 | 4.5 | 4.2 | 5.1 | 6.2 | 4.8 | 4.8 | 4.7 | 4.5 |
| New Brunswick | 11.7 | 11.4 | 10.4 | 10.7 | 10.0 | 10.1 | 10.2 | 10.1 | 10.1 | 10.1 | 9.6 |
| Campbellton–Miramichi | 22.8 | 21.7 | 19.9 | 20.5 | 19.0 | 19.7 | 19.0 | 20.4 | 19.2 | 19.0 | 19.2 |
| Moncton–Richibucto | 9.3 | 9.0 | 8.3 | 8.2 | 7.7 | 7.8 | 7.6 | 8.0 | 7.8 | 7.9 | 7.4 |
| Saint John–St. Stephen | 8.4 | 8.9 | 7.4 | 8.0 | 7.2 | 7.6 | 8.6 | 7.9 | 8.1 | 8.3 | 7.4 |
| Fredericton–Oromocto | 7.8 | 7.7 | 6.3 | 6.8 | 6.7 | 6.0 | 6.8 | 6.6 | 7.3 | 6.8 | 6.8 |
| Edmundston–Woodstock | 12.2 | 11.4 | 12.4 | 12.0 | 11.1 | 11.7 | 11.3 | 10.4 | 11.0 | 11.5 | 10.2 |
| Quebec | 7.3 | 7.2 | 6.5 | 6.5 | 6.5 | 7.0 | 7.2 | 6.4 | 6.5 | 6.4 | 6.3 |
| Gaspésie–Îles-de-la-Madeleine | 19.6 | 25.0 | 25.0 | 24.0 | 22.9 | 20.8 | 19.5 | 18.4 | 17.6 | 17.7 | 16.9 |
| Bas-Saint-Laurent | 13.2 | 11.7 | 11.1 | 10.5 | 9.9 | 10.1 | 9.9 | 9.5 | 10.4 | 9.7 | 9.0 |
| Capitale-Nationale | 8.1 | 8.1 | 6.4 | 6.1 | 6.2 | 6.7 | 6.5 | 6.1 | 6.1 | 5.5 | 5.9 |
| Chaudière–Appalaches | 7.6 | 7.7 | 6.4 | 6.2 | 6.4 | 7.1 | 7.1 | 6.9 | 6.6 | 6.1 | 6.1 |
| Estrie | 6.9 | 7.4 | 6.2 | 6.9 | 7.1 | 7.6 | 7.2 | 6.3 | 6.6 | 6.5 | 6.3 |
| Centre-du-Québec | 8.4 | 7.4 | 6.5 | 6.6 | 6.8 | 7.5 | 7.6 | 7.5 | 7.8 | 7.7 | 7.3 |
| Montérégie | 5.8 | 5.7 | 5.3 | 5.8 | 5.8 | 6.1 | 6.4 | 5.7 | 5.9 | 5.8 | 5.8 |
| Montréal | 5.7 | 5.5 | 4.9 | 4.9 | 5.1 | 5.5 | 6.0 | 5.1 | 5.2 | 5.4 | 5.2 |
| Laval | 5.3 | 5.0 | 4.7 | 4.9 | 4.8 | 5.1 | 5.7 | 5.0 | 5.2 | 5.1 | 4.9 |
| Lanaudière | 6.6 | 6.5 | 6.4 | 6.7 | 7.0 | 7.2 | 7.2 | 6.0 | 6.3 | 6.6 | 6.7 |
| Laurentides | 7.5 | 6.8 | 6.7 | 7.0 | 7.0 | 7.2 | 7.9 | 6.9 | 6.9 | 6.9 | 6.4 |
| Outaouais | 6.8 | 6.5 | 5.7 | 5.3 | 5.3 | 5.5 | 5.6 | 5.1 | 5.4 | 5.2 | 5.1 |
| Abitibi–Témiscamingue | 12.6 | 13.6 | 12.4 | 12.2 | 11.1 | 12.2 | 11.2 | 10.7 | 9.6 | 9.8 | 9.1 |
| Mauricie | 9.6 | 9.4 | 8.6 | 8.7 | 8.4 | 8.9 | 9.4 | 8.4 | 8.5 | 8.6 | 8.2 |
| Saguenay–Lac-Saint-Jean | 13.0 | 13.7 | 12.0 | 11.8 | 11.1 | 11.3 | 12.1 | 11.2 | 10.5 | 10.3 | 9.6 |
| Côte-Nord and Nord-du-Québec | 13.8 | 15.7 | 13.1 | 12.2 | 12.6 | 14.8 | 14.6 | 13.7 | 12.8 | 12.6 | 11.9 |
| Ontario | 4.4 | 4.3 | 4.1 | 4.2 | 4.3 | 5.3 | 5.7 | 5.0 | 5.0 | 4.8 | 4.9 |
| Ottawa | 4.2 | 3.8 | 3.5 | 3.8 | 3.6 | 3.9 | 4.3 | 4.0 | 4.1 | 3.9 | 4.1 |
| Kingston–Pembroke | 4.9 | 5.0 | 4.6 | 4.8 | 4.6 | 5.3 | 5.6 | 5.3 | 5.7 | 5.1 | 5.6 |
| Muskoka–Kawarthas | 5.4 | 5.6 | 5.0 | 5.5 | 5.0 | 5.7 | 6.6 | 5.9 | 6.0 | 5.5 | 6.0 |
| Toronto | 3.7 | 3.7 | 3.6 | 3.6 | 3.8 | 4.9 | 5.3 | 4.5 | 4.5 | 4.4 | 4.4 |
| Kitchener–Waterloo–Barrie | 3.9 | 4.0 | 3.9 | 4.1 | 4.2 | 5.3 | 5.8 | 5.0 | 5.0 | 4.7 | 4.9 |
| Hamilton–Niagara Peninsula | 4.8 | 4.6 | 4.4 | 4.3 | 4.5 | 5.6 | 6.1 | 5.3 | 5.3 | 4.9 | 5.0 |
| Sources: Statistics Canada, Canadian Employer–Employee Dynamics Database and Labour Force Survey. | |||||||||||
| 2003 | 2004 | 2005 | 2006 | 2007 | 2008 | 2009 | 2010 | 2011 | 2012 | 2013 | |
|---|---|---|---|---|---|---|---|---|---|---|---|
| percent | |||||||||||
| Ontario (continued) | |||||||||||
| London | 4.6 | 4.2 | 3.8 | 4.1 | 4.3 | 6.1 | 5.8 | 5.2 | 5.4 | 5.1 | 5.2 |
| Windsor–Sarnia | 5.4 | 5.9 | 5.5 | 6.2 | 6.4 | 8.4 | 7.6 | 7.2 | 7.4 | 7.1 | 6.5 |
| Stratford–Bruce Peninsula | 4.3 | 4.8 | 4.2 | 4.5 | 4.4 | 5.3 | 6.4 | 5.4 | 5.7 | 5.3 | 5.9 |
| Northeast | 7.6 | 7.1 | 7.0 | 7.2 | 6.7 | 7.2 | 8.5 | 8.0 | 7.4 | 7.3 | 7.4 |
| Northwest | 6.8 | 6.9 | 6.5 | 7.8 | 7.4 | 8.4 | 8.5 | 7.4 | 8.1 | 7.8 | 7.4 |
| Manitoba | 5.2 | 4.2 | 4.0 | 4.0 | 3.7 | 4.7 | 4.7 | 4.4 | 4.6 | 4.3 | 4.4 |
| Southeast | 4.3 | 3.6 | 3.4 | 3.9 | 3.8 | 5.2 | 4.9 | 4.6 | 4.4 | 4.7 | 4.7 |
| South Central and North Central | 5.9 | 5.0 | 4.8 | 4.6 | 4.2 | 4.5 | 5.0 | 4.3 | 4.8 | 4.5 | 4.6 |
| Southwest | 6.3 | 5.3 | 5.4 | 5.4 | 4.2 | 5.0 | 4.8 | 4.1 | 4.8 | 4.1 | 4.0 |
| Winnipeg | 4.8 | 3.7 | 3.4 | 3.5 | 3.4 | 4.4 | 4.5 | 4.1 | 4.3 | 4.1 | 4.1 |
| Interlake | 6.0 | 5.3 | 4.2 | 4.2 | 3.8 | 4.5 | 4.6 | 4.1 | 4.5 | 4.1 | 4.4 |
| Parklands and North | 7.7 | 7.2 | 7.6 | 7.2 | 5.9 | 6.5 | 6.7 | 7.1 | 7.6 | 7.3 | 7.4 |
| Saskatchewan | 5.8 | 5.1 | 5.0 | 5.1 | 4.3 | 4.7 | 5.2 | 4.6 | 4.9 | 4.6 | 4.9 |
| Regina–Moose Mountain | 4.5 | 3.9 | 3.9 | 3.8 | 3.5 | 3.8 | 4.2 | 3.7 | 3.8 | 3.7 | 4.4 |
| Swift Current–Moose Jaw | 5.5 | 4.8 | 4.7 | 5.0 | 4.4 | 4.3 | 5.4 | 4.4 | 4.7 | 4.4 | 4.7 |
| Saskatoon–Biggar | 5.1 | 4.7 | 4.3 | 4.1 | 3.6 | 3.9 | 4.6 | 4.3 | 4.7 | 4.5 | 4.3 |
| Yorkton–Melville | 6.4 | 6.2 | 6.0 | 5.9 | 4.7 | 5.4 | 6.2 | 5.2 | 5.4 | 5.0 | 5.6 |
| Prince Albert and Northern | 9.4 | 7.8 | 7.9 | 8.8 | 7.1 | 7.6 | 7.6 | 6.5 | 7.1 | 6.6 | 7.0 |
| Alberta | 5.8 | 5.2 | 4.7 | 4.4 | 4.1 | 5.0 | 6.6 | 5.4 | 5.2 | 4.8 | 5.0 |
| Lethbridge–Medicine Hat | 6.2 | 5.3 | 4.7 | 4.3 | 4.0 | 4.8 | 6.0 | 4.9 | 4.7 | 4.2 | 4.5 |
| Camrose–Drumheller | 6.1 | 5.4 | 5.3 | 4.9 | 4.5 | 4.9 | 6.1 | 5.4 | 5.2 | 5.0 | 5.3 |
| Calgary | 4.5 | 4.0 | 3.5 | 3.0 | 3.0 | 4.0 | 5.9 | 4.4 | 4.2 | 4.1 | 4.2 |
| Banff–Jasper–Rocky Mountain House–Grande Prairie–Peace River | 8.5 | 7.9 | 6.9 | 6.1 | 5.9 | 6.6 | 8.2 | 6.9 | 6.6 | 6.3 | 6.5 |
| Red Deer | 7.0 | 5.9 | 5.7 | 5.5 | 4.9 | 6.0 | 7.9 | 6.2 | 6.2 | 5.3 | 5.3 |
| Edmonton | 5.8 | 5.3 | 4.9 | 4.9 | 4.3 | 5.3 | 6.8 | 5.9 | 5.5 | 4.9 | 5.3 |
| Wood Buffalo–Cold Lake | 9.0 | 8.4 | 8.2 | 8.5 | 7.4 | 8.1 | 8.6 | 8.1 | 7.4 | 6.8 | 6.9 |
| British Columbia | 6.6 | 6.1 | 5.5 | 5.1 | 5.0 | 6.2 | 6.8 | 6.4 | 5.9 | 5.6 | 5.6 |
| Vancouver Island and Coast | 7.6 | 6.8 | 5.7 | 5.0 | 4.9 | 6.5 | 6.3 | 5.8 | 6.0 | 5.9 | 5.8 |
| Lower Mainland–Southwest | 5.3 | 4.8 | 4.3 | 3.9 | 3.9 | 4.9 | 5.7 | 5.7 | 4.9 | 4.6 | 4.7 |
| Thompson–Okanagan | 9.5 | 8.5 | 7.6 | 7.1 | 7.3 | 9.3 | 9.9 | 8.8 | 8.8 | 8.4 | 8.2 |
| Kootenay | 11.2 | 11.3 | 11.3 | 10.3 | 9.2 | 9.7 | 10.0 | 9.3 | 9.2 | 8.3 | 7.4 |
| Cariboo | 9.0 | 9.0 | 8.5 | 8.4 | 7.6 | 9.2 | 11.6 | 9.4 | 8.4 | 8.1 | 7.5 |
| North Coast and Nechako | 9.3 | 9.9 | 9.7 | 10.6 | 11.0 | 9.8 | 9.9 | 9.0 | 9.6 | 10.5 | 9.9 |
| Northeast | 10.2 | 9.8 | 10.2 | 10.4 | 9.3 | 11.4 | 11.1 | 8.9 | 9.2 | 8.8 | 7.6 |
| Yukon (Territory) | |||||||||||
| Yukon Territory | 10.6 | 11.0 | 10.6 | 9.4 | 10.1 | 10.1 | 9.8 | 9.2 | 10.1 | 8.7 | 9.1 |
| Northwest Territories | |||||||||||
| Northwest Territories | 5.7 | 5.4 | 4.8 | 4.4 | 4.1 | 4.8 | 6.1 | 5.9 | 5.3 | 5.1 | 4.5 |
| Nunavut | |||||||||||
| Nunavut | Note ...: not applicable | Note ...: not applicable | Note ...: not applicable | Note ...: not applicable | Note ...: not applicable | Note ...: not applicable | Note ...: not applicable | 15.4 | 15.1 | 14.4 | 10.9 |
| ... not applicable Sources: Statistics Canada, Canadian Employer–Employee Dynamics Database and Labour Force Survey. |
|||||||||||
| 2003 | 2004 | 2005 | 2006 | 2007 | 2008 | 2009 | 2010 | 2011 | 2012 | 2013 | |
|---|---|---|---|---|---|---|---|---|---|---|---|
| percent | |||||||||||
| Canada | 16.3 | 17.0 | 17.0 | 17.5 | 17.6 | 17.2 | 14.8 | 15.9 | 16.4 | 16.2 | 16.2 |
| Newfoundland and Labrador | 18.9 | 21.5 | 18.8 | 20.9 | 22.6 | 21.8 | 18.6 | 18.8 | 20.2 | 20.0 | 23.1 |
| Avalon Peninsula | 16.7 | 17.0 | 16.9 | 17.9 | 20.9 | 19.0 | 16.9 | 16.0 | 17.7 | 17.6 | 19.9 |
| South Coast–Burin Peninsula and Notre Dame–Central Bonavista Bay | 22.1 | 27.4 | 21.8 | 27.1 | 27.6 | 27.4 | 21.6 | 24.0 | 24.5 | 23.7 | 28.8 |
| West Coast–Northern Peninsula–Labrador | 20.4 | 25.4 | 19.9 | 21.2 | 21.1 | 22.4 | 19.7 | 20.5 | 22.8 | 23.2 | 26.5 |
| Prince Edward Island | |||||||||||
| Prince Edward Island | 21.8 | 17.6 | 19.0 | 19.1 | 19.4 | 18.5 | 16.5 | 17.2 | 16.7 | 16.0 | 16.2 |
| Nova Scotia | 16.5 | 16.5 | 16.6 | 16.8 | 17.4 | 16.7 | 14.7 | 17.7 | 15.2 | 15.0 | 15.0 |
| Cape Breton | 19.2 | 18.1 | 20.1 | 19.9 | 20.5 | 18.9 | 19.0 | 18.9 | 18.4 | 18.3 | 18.5 |
| North Shore | 17.2 | 16.8 | 16.1 | 16.5 | 18.1 | 17.2 | 14.5 | 16.4 | 15.7 | 15.2 | 15.3 |
| Annapolis Valley | 16.1 | 16.6 | 16.0 | 16.3 | 16.6 | 16.4 | 15.0 | 16.8 | 16.7 | 16.5 | 15.0 |
| Southern | 16.2 | 16.8 | 15.9 | 18.1 | 17.8 | 16.3 | 14.7 | 16.2 | 14.8 | 14.9 | 17.0 |
| Halifax | 15.7 | 15.9 | 16.1 | 15.9 | 16.5 | 16.0 | 13.6 | 18.5 | 14.0 | 13.8 | 13.7 |
| New Brunswick | 17.6 | 17.5 | 17.9 | 18.1 | 19.1 | 18.8 | 16.0 | 16.1 | 16.0 | 15.6 | 15.8 |
| Campbellton–Miramichi | 19.9 | 20.3 | 21.3 | 19.8 | 21.4 | 21.2 | 19.6 | 19.4 | 19.0 | 18.7 | 18.6 |
| Moncton–Richibucto | 17.4 | 16.6 | 17.4 | 17.6 | 18.8 | 19.0 | 15.8 | 16.2 | 16.3 | 15.2 | 15.1 |
| Saint John–St. Stephen | 17.8 | 16.7 | 16.8 | 18.2 | 19.7 | 19.0 | 15.6 | 15.5 | 15.2 | 14.4 | 15.2 |
| Fredericton–Oromocto | 16.9 | 16.7 | 17.0 | 17.5 | 17.5 | 16.7 | 14.2 | 14.4 | 14.4 | 14.3 | 15.4 |
| Edmundston–Woodstock | 15.1 | 17.8 | 16.2 | 16.7 | 16.9 | 16.4 | 14.3 | 14.3 | 15.0 | 16.6 | 15.3 |
| Quebec | 16.5 | 16.7 | 16.4 | 16.4 | 16.9 | 16.6 | 15.2 | 15.5 | 16.1 | 15.5 | 15.0 |
| Gaspésie–Îles-de-la-Madeleine | 20.5 | 22.2 | 21.3 | 23.6 | 23.5 | 20.4 | 20.2 | 19.2 | 19.2 | 18.4 | 17.7 |
| Bas-Saint-Laurent | 17.5 | 16.1 | 15.0 | 15.1 | 15.7 | 16.0 | 15.6 | 15.7 | 16.8 | 15.6 | 14.6 |
| Capitale-Nationale | 16.2 | 15.4 | 14.9 | 15.5 | 16.0 | 16.2 | 14.7 | 14.8 | 14.9 | 14.6 | 13.9 |
| Chaudière-Appalaches | 14.5 | 15.2 | 13.9 | 14.0 | 14.6 | 15.3 | 13.5 | 14.0 | 13.8 | 12.7 | 12.9 |
| Estrie | 15.0 | 14.9 | 15.3 | 15.8 | 17.1 | 15.6 | 13.5 | 14.1 | 14.5 | 14.7 | 14.7 |
| Centre-du-Québec | 16.9 | 15.7 | 14.8 | 14.3 | 16.2 | 15.1 | 13.4 | 15.0 | 15.6 | 15.6 | 15.0 |
| Montérégie | 14.7 | 15.6 | 15.6 | 15.4 | 15.4 | 15.2 | 14.2 | 14.2 | 15.1 | 14.2 | 14.0 |
| Montréal | 18.7 | 19.4 | 19.2 | 19.0 | 19.0 | 19.2 | 17.4 | 18.0 | 18.8 | 18.6 | 18.1 |
| Laval | 16.0 | 16.5 | 16.5 | 16.3 | 15.7 | 15.1 | 14.9 | 15.5 | 16.5 | 15.3 | 14.1 |
| Lanaudière | 15.1 | 15.8 | 15.5 | 15.5 | 16.1 | 15.6 | 14.4 | 13.5 | 13.4 | 13.5 | 13.6 |
| Laurentides | 17.1 | 16.4 | 16.0 | 16.1 | 16.8 | 16.2 | 14.7 | 14.9 | 15.3 | 14.4 | 13.8 |
| Outaouais | 15.1 | 14.0 | 13.6 | 14.2 | 14.4 | 14.0 | 12.6 | 11.6 | 11.9 | 11.2 | 11.3 |
| Abitibi-Témiscamingue | 17.9 | 18.5 | 18.1 | 18.3 | 21.8 | 18.5 | 16.2 | 19.4 | 19.3 | 19.0 | 16.4 |
| Mauricie | 16.3 | 15.7 | 15.4 | 16.5 | 17.1 | 16.0 | 14.5 | 15.5 | 16.1 | 15.3 | 15.5 |
| Saguenay–Lac-Saint-Jean | 16.8 | 17.1 | 16.4 | 16.8 | 17.6 | 16.7 | 14.9 | 16.6 | 19.1 | 16.0 | 14.9 |
| Côte-Nord and Nord-du-Québec | 18.9 | 18.9 | 17.4 | 17.2 | 20.1 | 20.7 | 19.0 | 19.8 | 22.2 | 20.0 | 18.3 |
| Ontario | 15.3 | 15.8 | 15.5 | 15.6 | 15.6 | 15.3 | 13.4 | 14.8 | 14.9 | 14.5 | 14.5 |
| Ottawa | 14.3 | 14.0 | 14.1 | 14.6 | 14.2 | 14.6 | 12.7 | 13.1 | 12.5 | 11.5 | 11.5 |
| Kingston–Pembroke | 15.7 | 16.3 | 15.4 | 14.9 | 14.4 | 15.0 | 12.4 | 13.8 | 13.6 | 13.6 | 14.0 |
| Muskoka–Kawarthas | 14.8 | 14.2 | 14.2 | 13.4 | 13.1 | 13.4 | 12.4 | 13.3 | 13.4 | 13.2 | 13.7 |
| Toronto | 16.3 | 17.0 | 16.7 | 17.0 | 16.7 | 16.5 | 14.2 | 15.7 | 15.9 | 15.8 | 15.7 |
| Kitchener–Waterloo–Barrie | 15.4 | 15.3 | 14.4 | 14.0 | 14.2 | 14.1 | 12.4 | 14.3 | 13.8 | 13.3 | 13.4 |
| Hamilton–Niagara Peninsula | 14.3 | 15.3 | 14.8 | 14.7 | 14.9 | 14.1 | 12.4 | 13.9 | 14.3 | 14.1 | 14.1 |
| Sources: Statistics Canada, Canadian Employer–Employee Dynamics Database and Labour Force Survey. | |||||||||||
| 2003 | 2004 | 2005 | 2006 | 2007 | 2008 | 2009 | 2010 | 2011 | 2012 | 2013 | |
|---|---|---|---|---|---|---|---|---|---|---|---|
| percent | |||||||||||
| Ontario (continued) | |||||||||||
| London | 14.5 | 15.1 | 14.2 | 13.8 | 13.8 | 13.1 | 12.7 | 14.5 | 14.1 | 13.7 | 13.9 |
| Windsor–Sarnia | 14.2 | 13.9 | 14.1 | 13.5 | 15.0 | 13.7 | 13.3 | 15.0 | 15.3 | 14.2 | 14.5 |
| Stratford–Bruce Peninsula | 12.1 | 12.0 | 12.2 | 12.9 | 12.9 | 14.7 | 11.7 | 12.7 | 13.0 | 12.8 | 14.5 |
| Northeast | 15.2 | 15.8 | 17.3 | 16.5 | 17.3 | 15.8 | 13.9 | 15.6 | 16.2 | 15.4 | 14.5 |
| Northwest | 13.9 | 14.3 | 13.8 | 15.8 | 17.6 | 15.5 | 14.6 | 15.2 | 17.3 | 15.4 | 15.2 |
| Manitoba | 16.0 | 15.8 | 15.5 | 17.0 | 16.9 | 16.5 | 14.5 | 14.8 | 15.9 | 15.6 | 15.9 |
| Southeast | 13.1 | 13.0 | 12.7 | 13.6 | 14.8 | 14.5 | 13.5 | 13.0 | 13.2 | 14.3 | 13.3 |
| South Central and North Central | 15.2 | 14.9 | 13.7 | 20.5 | 17.7 | 16.4 | 12.6 | 13.0 | 15.2 | 14.2 | 14.4 |
| Southwest | 15.7 | 17.0 | 17.2 | 18.5 | 18.8 | 18.6 | 17.1 | 17.0 | 17.7 | 18.1 | 16.3 |
| Winnipeg | 16.4 | 16.2 | 16.0 | 17.3 | 17.3 | 16.9 | 14.8 | 15.3 | 16.6 | 16.1 | 16.6 |
| Interlake | 15.5 | 14.2 | 12.5 | 12.7 | 12.1 | 12.3 | 10.8 | 10.3 | 11.3 | 11.0 | 11.9 |
| Parklands and North | 17.3 | 16.1 | 17.6 | 17.7 | 17.9 | 17.8 | 16.1 | 16.8 | 16.2 | 16.3 | 17.5 |
| Saskatchewan | 14.5 | 14.9 | 15.6 | 16.9 | 17.3 | 18.3 | 15.8 | 16.1 | 18.0 | 18.9 | 18.9 |
| Regina–Moose Mountain | 13.5 | 14.2 | 14.4 | 16.2 | 16.9 | 18.4 | 16.1 | 16.3 | 18.4 | 18.4 | 18.7 |
| Swift Current–Moose Jaw | 13.8 | 14.5 | 15.2 | 15.5 | 15.4 | 17.4 | 15.1 | 14.5 | 17.7 | 17.8 | 18.5 |
| Saskatoon–Biggar | 14.3 | 15.1 | 15.9 | 16.5 | 17.2 | 18.3 | 15.4 | 16.2 | 18.1 | 20.1 | 19.1 |
| Yorkton–Melville | 15.3 | 14.8 | 13.9 | 14.7 | 15.2 | 17.2 | 15.6 | 15.3 | 16.2 | 18.2 | 18.4 |
| Prince Albert and Northern | 16.7 | 16.2 | 17.9 | 20.3 | 20.0 | 19.3 | 16.7 | 17.0 | 18.2 | 18.5 | 19.5 |
| Alberta | 19.5 | 21.2 | 23.1 | 24.2 | 23.4 | 22.5 | 17.0 | 19.2 | 21.1 | 21.5 | 21.4 |
| Lethbridge–Medicine Hat | 19.2 | 20.0 | 20.3 | 19.8 | 19.8 | 21.4 | 18.2 | 17.2 | 18.4 | 18.0 | 20.9 |
| Camrose–Drumheller | 17.7 | 19.1 | 20.4 | 21.1 | 20.7 | 18.5 | 14.0 | 16.0 | 18.5 | 19.3 | 20.2 |
| Calgary | 19.2 | 21.4 | 23.2 | 23.9 | 22.8 | 21.5 | 15.8 | 18.9 | 21.2 | 21.0 | 20.8 |
| Banff–Jasper–Rocky Mountain House–Grande Prairie–Peace River | 21.9 | 23.8 | 25.4 | 25.5 | 24.4 | 24.4 | 17.9 | 20.3 | 21.6 | 23.5 | 24.7 |
| Red Deer | 21.1 | 23.1 | 25.5 | 26.7 | 24.6 | 23.0 | 17.8 | 21.2 | 23.0 | 22.5 | 20.9 |
| Edmonton | 18.8 | 20.4 | 22.3 | 24.4 | 24.1 | 23.2 | 17.6 | 19.2 | 21.0 | 21.9 | 21.3 |
| Wood Buffalo–Cold Lake | 22.8 | 23.5 | 28.2 | 32.3 | 30.4 | 29.8 | 23.5 | 24.5 | 24.1 | 26.0 | 24.5 |
| British Columbia | 16.0 | 17.9 | 18.5 | 19.4 | 19.5 | 18.6 | 15.7 | 16.4 | 17.0 | 17.2 | 17.4 |
| Vancouver Island and Coast | 16.4 | 17.5 | 17.6 | 18.0 | 17.9 | 16.9 | 14.4 | 14.9 | 16.1 | 16.7 | 16.7 |
| Lower Mainland–Southwest | 15.5 | 17.5 | 18.1 | 19.1 | 19.5 | 18.5 | 16.0 | 16.3 | 16.6 | 16.5 | 16.9 |
| Thompson–Okanagan | 17.5 | 18.9 | 19.5 | 20.2 | 21.3 | 20.0 | 15.8 | 17.1 | 18.3 | 19.2 | 19.9 |
| Kootenay | 18.6 | 22.2 | 21.8 | 23.2 | 20.1 | 19.2 | 16.8 | 19.1 | 18.7 | 19.1 | 16.7 |
| Cariboo | 15.3 | 19.2 | 20.1 | 20.1 | 18.0 | 20.1 | 15.8 | 18.3 | 19.3 | 17.8 | 18.1 |
| North Coast and Nechako | 14.5 | 16.5 | 18.7 | 19.8 | 19.7 | 19.0 | 12.9 | 13.6 | 17.6 | 19.3 | 20.9 |
| Northeast | 20.4 | 23.0 | 27.4 | 30.5 | 25.3 | 27.1 | 20.8 | 23.5 | 24.8 | 26.4 | 23.9 |
| Yukon (Territory) | |||||||||||
| Yukon Territory | 21.2 | 20.2 | 20.4 | 20.8 | 22.5 | 20.4 | 20.8 | 21.1 | 21.8 | 19.6 | 17.7 |
| Northwest Territories | |||||||||||
| Northwest Territories | 19.3 | 18.0 | 16.9 | 17.8 | 17.3 | 16.6 | 15.8 | 16.0 | 15.5 | 15.5 | 16.1 |
| Nunavut | |||||||||||
| Nunavut | Note ...: not applicable | Note ...: not applicable | Note ...: not applicable | Note ...: not applicable | Note ...: not applicable | Note ...: not applicable | Note ...: not applicable | 30.6 | 30.7 | 30.3 | 27.2 |
| ... not applicable Sources: Statistics Canada, Canadian Employer–Employee Dynamics Database and Labour Force Survey. |
|||||||||||
| 2003 | 2004 | 2005 | 2006 | 2007 | 2008 | 2009 | 2010 | 2011 | 2012 | 2013 | |
|---|---|---|---|---|---|---|---|---|---|---|---|
| percent | |||||||||||
| Canada | 5.3 | 5.1 | 4.7 | 4.6 | 4.6 | 5.3 | 5.9 | 5.1 | 5.0 | 4.8 | 4.8 |
| Newfoundland and Labrador | 14.1 | 16.0 | 14.9 | 13.8 | 13.8 | 13.2 | 13.3 | 11.9 | 12.2 | 11.0 | 11.4 |
| Avalon Peninsula | 9.4 | 9.7 | 9.8 | 9.2 | 8.8 | 8.9 | 8.9 | 7.9 | 7.9 | 7.0 | 8.0 |
| South Coast–Burin Peninsula and Notre Dame–Central Bonavista Bay | 21.2 | 27.1 | 22.4 | 21.8 | 23.9 | 21.4 | 21.3 | 19.4 | 20.1 | 18.8 | 18.7 |
| West Coast–Northern Peninsula–Labrador | 17.1 | 17.9 | 18.0 | 15.4 | 14.7 | 14.7 | 15.6 | 14.7 | 15.7 | 14.2 | 13.7 |
| Prince Edward Island | |||||||||||
| Prince Edward Island | 13.0 | 12.4 | 10.6 | 10.6 | 9.7 | 9.9 | 13.7 | 11.4 | 9.5 | 9.0 | 8.9 |
| Nova Scotia | 7.7 | 7.3 | 7.0 | 6.7 | 6.4 | 6.7 | 8.6 | 6.6 | 6.5 | 6.3 | 6.0 |
| Cape Breton | 13.4 | 13.7 | 13.1 | 13.0 | 11.8 | 12.3 | 12.8 | 12.4 | 12.1 | 11.8 | 12.4 |
| North Shore | 9.3 | 9.0 | 8.2 | 7.8 | 8.4 | 7.5 | 10.1 | 8.1 | 7.7 | 7.6 | 7.2 |
| Annapolis Valley | 7.4 | 7.0 | 6.5 | 6.3 | 6.3 | 5.9 | 10.6 | 7.3 | 7.9 | 6.9 | 5.6 |
| Southern | 10.7 | 9.6 | 9.4 | 9.9 | 9.4 | 9.5 | 12.4 | 8.7 | 9.1 | 8.7 | 8.8 |
| Halifax | 4.9 | 4.5 | 4.4 | 3.9 | 3.7 | 4.5 | 5.5 | 4.1 | 4.0 | 3.9 | 3.7 |
| New Brunswick | 10.1 | 10.0 | 9.1 | 9.4 | 8.7 | 8.7 | 8.6 | 8.3 | 8.3 | 8.3 | 7.9 |
| Campbellton–Miramichi | 19.6 | 18.8 | 17.4 | 17.8 | 16.4 | 17.3 | 16.2 | 17.1 | 15.9 | 15.3 | 15.5 |
| Moncton–Richibucto | 7.9 | 7.7 | 7.0 | 7.0 | 6.6 | 6.7 | 6.3 | 6.4 | 6.2 | 6.4 | 6.1 |
| Saint John–St. Stephen | 7.2 | 7.8 | 6.4 | 6.9 | 6.3 | 6.4 | 7.4 | 6.6 | 6.7 | 7.1 | 6.2 |
| Fredericton–Oromocto | 6.5 | 6.7 | 5.5 | 5.9 | 5.9 | 5.1 | 6.0 | 5.4 | 5.9 | 5.6 | 5.6 |
| Edmundston–Woodstock | 10.1 | 9.6 | 10.6 | 10.3 | 9.5 | 9.7 | 9.3 | 8.3 | 8.8 | 9.4 | 8.2 |
| Quebec | 6.2 | 6.1 | 5.6 | 5.6 | 5.6 | 5.9 | 6.2 | 5.5 | 5.4 | 5.4 | 5.3 |
| Gaspésie–Îles-de-la-Madeleine | 16.3 | 21.0 | 21.8 | 21.1 | 19.3 | 16.9 | 15.9 | 14.8 | 14.6 | 14.0 | 14.0 |
| Bas-Saint-Laurent | 10.8 | 9.5 | 9.5 | 8.6 | 8.5 | 8.4 | 8.2 | 7.9 | 8.6 | 8.1 | 7.4 |
| Capitale-Nationale | 6.8 | 6.7 | 5.3 | 5.1 | 5.3 | 5.5 | 5.6 | 5.2 | 5.0 | 4.6 | 4.9 |
| Chaudière-Appalaches | 6.0 | 6.0 | 5.1 | 4.9 | 5.2 | 5.5 | 5.7 | 5.5 | 5.2 | 4.8 | 4.9 |
| Estrie | 5.7 | 5.8 | 5.0 | 5.9 | 6.1 | 6.4 | 5.9 | 5.1 | 5.4 | 5.2 | 5.4 |
| Centre-du-Québec | 6.9 | 6.1 | 5.3 | 5.2 | 5.4 | 5.9 | 6.2 | 6.2 | 6.3 | 6.0 | 5.7 |
| Montérégie | 4.7 | 4.7 | 4.4 | 4.7 | 4.7 | 5.0 | 5.4 | 4.7 | 4.8 | 4.7 | 4.8 |
| Montréal | 5.4 | 5.2 | 4.7 | 4.6 | 4.9 | 5.2 | 5.7 | 4.8 | 4.8 | 5.0 | 4.9 |
| Laval | 4.5 | 4.2 | 4.1 | 4.2 | 4.0 | 4.3 | 4.9 | 4.3 | 4.5 | 4.4 | 4.3 |
| Lanaudière | 5.4 | 5.3 | 5.4 | 5.5 | 6.0 | 6.1 | 6.2 | 4.9 | 5.0 | 5.3 | 5.4 |
| Laurentides | 6.2 | 5.6 | 5.5 | 5.8 | 6.0 | 5.9 | 6.7 | 5.8 | 5.7 | 5.5 | 5.3 |
| Outaouais | 5.9 | 5.6 | 5.0 | 4.4 | 4.4 | 4.4 | 4.5 | 4.1 | 4.2 | 4.1 | 4.1 |
| Abitibi-Témiscamingue | 10.0 | 11.0 | 10.2 | 10.1 | 9.0 | 9.9 | 9.3 | 8.9 | 7.8 | 7.8 | 7.1 |
| Mauricie | 7.9 | 7.8 | 7.0 | 7.2 | 7.0 | 7.3 | 8.2 | 7.2 | 6.9 | 7.0 | 6.9 |
| Saguenay–Lac-Saint-Jean | 10.6 | 11.2 | 9.8 | 9.9 | 9.1 | 9.2 | 10.1 | 9.0 | 8.5 | 8.5 | 7.9 |
| Côte-Nord and Nord-du-Québec | 11.2 | 12.9 | 10.7 | 10.0 | 10.8 | 12.7 | 12.3 | 11.6 | 11.0 | 10.5 | 10.1 |
| Ontario | 3.9 | 3.9 | 3.6 | 3.7 | 3.8 | 4.8 | 5.1 | 4.3 | 4.2 | 4.1 | 4.1 |
| Ottawa | 3.9 | 3.4 | 3.0 | 3.4 | 3.1 | 3.3 | 3.7 | 3.3 | 3.3 | 3.1 | 3.2 |
| Kingston–Pembroke | 4.3 | 4.3 | 3.9 | 4.1 | 3.7 | 4.5 | 4.7 | 4.4 | 4.6 | 4.1 | 4.6 |
| Muskoka–Kawarthas | 4.5 | 4.9 | 4.2 | 4.7 | 4.1 | 4.9 | 5.5 | 4.9 | 4.9 | 4.7 | 5.0 |
| Toronto | 3.5 | 3.5 | 3.4 | 3.3 | 3.6 | 4.6 | 5.0 | 4.1 | 4.0 | 3.9 | 3.9 |
| Kitchener–Waterloo–Barrie | 3.4 | 3.5 | 3.4 | 3.5 | 3.5 | 4.5 | 5.1 | 4.1 | 3.9 | 3.8 | 4.0 |
| Hamilton–Niagara Peninsula | 4.2 | 4.1 | 3.8 | 3.6 | 3.9 | 4.9 | 5.4 | 4.6 | 4.4 | 4.2 | 4.1 |
| Sources: Statistics Canada, Canadian Employer–Employee Dynamics Database and Labour Force Survey. | |||||||||||
| 2003 | 2004 | 2005 | 2006 | 2007 | 2008 | 2009 | 2010 | 2011 | 2012 | 2013 | |
|---|---|---|---|---|---|---|---|---|---|---|---|
| percent | |||||||||||
| Ontario (continued) | |||||||||||
| London | 3.8 | 3.4 | 3.1 | 3.4 | 3.6 | 5.6 | 5.2 | 4.4 | 4.4 | 4.2 | 4.2 |
| Windsor–Sarnia | 4.5 | 5.1 | 4.7 | 5.4 | 5.7 | 7.8 | 6.7 | 6.3 | 6.4 | 6.3 | 5.5 |
| Stratford–Bruce Peninsula | 3.3 | 3.9 | 3.4 | 3.4 | 3.5 | 4.3 | 5.3 | 4.2 | 4.4 | 4.3 | 4.8 |
| Northeast | 6.4 | 5.8 | 5.8 | 6.1 | 5.7 | 6.0 | 7.2 | 6.7 | 6.0 | 5.9 | 6.0 |
| Northwest | 5.8 | 5.8 | 5.7 | 7.1 | 6.5 | 7.4 | 7.4 | 5.9 | 6.6 | 6.5 | 6.0 |
| Manitoba | 4.5 | 3.5 | 3.3 | 3.3 | 3.1 | 3.9 | 4.0 | 3.6 | 3.7 | 3.6 | 3.7 |
| Southeast | 3.4 | 3.0 | 2.7 | 3.0 | 2.8 | 4.1 | 3.7 | 3.6 | 3.2 | 3.6 | 3.4 |
| South Central and North Central | 4.5 | 3.7 | 3.8 | 3.5 | 3.1 | 3.2 | 3.7 | 3.2 | 3.6 | 3.2 | 3.4 |
| Southwest | 4.6 | 3.9 | 4.1 | 4.1 | 3.1 | 3.9 | 3.8 | 3.4 | 3.9 | 3.2 | 3.1 |
| Winnipeg | 4.4 | 3.3 | 3.0 | 3.0 | 3.0 | 3.9 | 4.0 | 3.6 | 3.6 | 3.6 | 3.6 |
| Interlake | 4.7 | 4.0 | 3.1 | 3.1 | 2.8 | 3.3 | 3.4 | 2.8 | 3.1 | 2.9 | 3.3 |
| Parklands and North | 6.3 | 5.9 | 6.3 | 6.1 | 4.9 | 5.3 | 5.7 | 5.9 | 6.2 | 6.2 | 6.2 |
| Saskatchewan | 4.7 | 4.1 | 4.1 | 4.3 | 3.6 | 3.9 | 4.4 | 3.9 | 4.1 | 3.9 | 4.3 |
| Regina–Moose Mountain | 3.7 | 3.2 | 3.3 | 3.2 | 2.9 | 3.2 | 3.6 | 3.1 | 3.1 | 3.1 | 3.9 |
| Swift Current–Moose Jaw | 3.9 | 3.4 | 3.6 | 4.3 | 3.6 | 3.4 | 4.4 | 3.4 | 3.7 | 3.6 | 4.0 |
| Saskatoon–Biggar | 4.1 | 3.8 | 3.5 | 3.4 | 2.9 | 3.2 | 4.0 | 3.8 | 4.0 | 4.0 | 3.9 |
| Yorkton–Melville | 4.8 | 4.6 | 4.4 | 4.5 | 3.6 | 4.2 | 4.9 | 4.1 | 4.3 | 3.9 | 4.7 |
| Prince Albert and Northern | 7.9 | 6.1 | 6.6 | 7.7 | 5.9 | 6.4 | 6.5 | 5.5 | 5.9 | 5.6 | 6.1 |
| Alberta | 5.1 | 4.5 | 4.1 | 3.8 | 3.6 | 4.5 | 6.2 | 4.9 | 4.6 | 4.2 | 4.5 |
| Lethbridge–Medicine Hat | 5.1 | 4.5 | 3.9 | 3.4 | 3.2 | 4.1 | 5.4 | 4.1 | 3.9 | 3.3 | 3.8 |
| Camrose–Drumheller | 4.9 | 4.3 | 4.3 | 4.0 | 3.6 | 4.1 | 5.2 | 4.7 | 4.4 | 4.0 | 4.5 |
| Calgary | 4.0 | 3.6 | 3.1 | 2.6 | 2.6 | 3.6 | 5.5 | 3.9 | 3.8 | 3.7 | 3.7 |
| Banff–Jasper–Rocky Mountain House–Grande Prairie–Peace River | 7.2 | 6.5 | 5.9 | 5.4 | 5.1 | 5.8 | 7.4 | 6.0 | 5.7 | 5.4 | 5.6 |
| Red Deer | 5.9 | 5.0 | 5.0 | 4.9 | 4.4 | 5.3 | 7.5 | 5.7 | 5.7 | 4.5 | 4.6 |
| Edmonton | 5.3 | 4.8 | 4.5 | 4.5 | 3.9 | 4.9 | 6.6 | 5.6 | 5.0 | 4.6 | 4.9 |
| Wood Buffalo–Cold Lake | 7.8 | 7.3 | 7.1 | 7.4 | 6.5 | 7.2 | 7.8 | 7.1 | 6.6 | 6.0 | 5.9 |
| British Columbia | 5.9 | 5.3 | 4.7 | 4.4 | 4.4 | 5.5 | 6.1 | 5.7 | 5.2 | 4.9 | 4.9 |
| Vancouver Island and Coast | 6.9 | 6.2 | 5.1 | 4.4 | 4.2 | 5.6 | 5.5 | 5.1 | 5.4 | 5.1 | 5.1 |
| Lower Mainland–Southwest | 4.8 | 4.3 | 3.8 | 3.5 | 3.5 | 4.5 | 5.3 | 5.2 | 4.4 | 4.1 | 4.3 |
| Thompson–Okanagan | 8.1 | 7.1 | 6.4 | 6.0 | 6.3 | 8.1 | 8.4 | 7.3 | 7.4 | 7.2 | 7.2 |
| Kootenay | 9.5 | 9.5 | 9.6 | 9.1 | 8.1 | 8.3 | 9.0 | 8.3 | 8.1 | 7.1 | 6.2 |
| Cariboo | 7.5 | 7.8 | 7.3 | 7.6 | 6.7 | 8.0 | 10.7 | 8.5 | 7.5 | 6.9 | 6.1 |
| North Coast and Nechako | 8.3 | 8.6 | 8.8 | 10.2 | 10.2 | 8.5 | 8.7 | 7.8 | 8.2 | 9.2 | 8.6 |
| Northeast | 8.6 | 7.9 | 8.7 | 9.4 | 7.9 | 10.2 | 10.4 | 7.9 | 7.7 | 8.0 | 6.9 |
| Yukon (Territory) | |||||||||||
| Yukon Territory | 9.5 | 9.6 | 9.4 | 7.6 | 8.5 | 8.8 | 8.7 | 8.3 | 9.1 | 7.5 | 7.9 |
| Northwest Territories | |||||||||||
| Northwest Territories | 4.9 | 4.8 | 4.2 | 3.8 | 3.5 | 4.0 | 5.3 | 4.9 | 4.4 | 4.4 | 4.0 |
| Nunavut | |||||||||||
| Nunavut | Note ...: not applicable | Note ...: not applicable | Note ...: not applicable | Note ...: not applicable | Note ...: not applicable | Note ...: not applicable | Note ...: not applicable | 14.0 | 13.9 | 13.2 | 10.1 |
| ... not applicable Sources: Statistics Canada, Canadian Employer–Employee Dynamics Database and Labour Force Survey. |
|||||||||||
| Economic region name | Ascending order |
|---|---|
| number | |
| Ottawa | 1 |
| Regina-Moose Mountain | 2 |
| Winnipeg | 3 |
| Calgary | 4 |
| Toronto | 5 |
| Southeast | 6 |
| Saskatoon-Biggar | 7 |
| Interlake | 8 |
| Kitchener-Waterloo-Barrie | 9 |
| South Central and North Central | 10 |
| Swift Current-Moose Jaw | 11 |
| Lower Mainland-Southwest | 12 |
| Southwest | 13 |
| Lethbridge-Medicine Hat | 14 |
| London | 15 |
| Halifax | 16 |
| Hamilton-Niagara Peninsula | 17 |
| Laval | 18 |
| Stratford-Bruce Peninsula | 19 |
| Northwest Territories | 20 |
| Kingston-Pembroke | 21 |
| Camrose-Drumheller | 22 |
| Montréal | 23 |
| Edmonton | 24 |
| Outaouais | 25 |
| Yorkton-Melville | 26 |
| Muskoka-Kawarthas | 27 |
| Montérégie | 28 |
| Red Deer | 29 |
| Vancouver Island and Coast | 30 |
| Capitale-Nationale (Quebec) | 31 |
| Lanaudière | 32 |
| Windsor-Sarnia | 33 |
| Chaudière-Appalaches | 34 |
| Estrie | 35 |
| Fredericton-Oromocto | 36 |
| Banff-Jasper-Rocky Mountain House and Athabasca-Grande Prairie-Peace River |
37 |
| Laurentides | 38 |
| Parklands and North | 39 |
| Centre-du-Québec | 40 |
| Northeast (Ontario) | 41 |
| Northwest | 42 |
| Prince Albert and Northern | 43 |
| Wood Buffalo-Cold Lake | 44 |
| Saint John-St. Stephen | 45 |
| Moncton-Richibucto | 46 |
| Annapolis Valley | 47 |
| Thompson-Okanagan | 48 |
| Mauricie | 49 |
| Cariboo | 50 |
| Source: Statistics Canada, Canadian Socio-Economic Information Management System (CANSIM). | |
| Economic region name | Ascending order |
|---|---|
| number | |
| North Shore | 51 |
| Northeast (British Columbia) | 52 |
| Kootenay | 53 |
| Yukon Territory | 54 |
| North Coast and Nechako | 55 |
| Avalon Peninsula | 56 |
| Bas-Saint-Laurent | 57 |
| Southern | 58 |
| Abitibi-Témiscamingue | 59 |
| Edmundston-Woodstock | 60 |
| Saguenay-Lac-Saint-Jean | 61 |
| Prince Edward Island | 62 |
| Côte-Nord and Nord-du-Québec | 63 |
| Nunavut | 64 |
| Cape Breton | 65 |
| West Coast-Northern Peninsula-Labrador | 66 |
| Campbellton-Miramichi | 67 |
| Gaspésie-Îles-de-la-Madeleine | 68 |
| South Coast–Burin Peninsula and Notre Dame–Central Bonavista Bay | 69 |
| Source: Statistics Canada, Canadian Socio-Economic Information Management System (CANSIM). | |
| Econonic region name | Ascending order |
|---|---|
| number | |
| Wood Buffalo-Cold Lake | 1 |
| Red Deer | 2 |
| Camrose-Drumheller | 3 |
| Calgary | 4 |
| Banff–Jasper–Rocky Mountain House and Athabasca–Grande Prairie–Peace River |
5 |
| Edmonton | 6 |
| North Coast and Nechako | 7 |
| Northeast (British Columbia) | 8 |
| South Coast-Burin Peninsula and Notre Dame-Central Bonavista Bay | 9 |
| Abitibi-Témiscamingue | 10 |
| Thompson-Okanagan | 11 |
| South Central and North Central | 12 |
| Vancouver Island and Coast | 13 |
| Prince Albert and Northern | 14 |
| Kootenay | 15 |
| Lower Mainland-Southwest | 16 |
| Lethbridge-Medicine Hat | 17 |
| Avalon Peninsula | 18 |
| Gaspésie-Îles-de-la-Madeleine | 19 |
| Northeast (Ontario) | 20 |
| Saint John-St. Stephen | 21 |
| Mauricie | 22 |
| Estrie | 23 |
| Moncton-Richibucto | 24 |
| Prince Edward Island | 25 |
| Halifax | 26 |
| Yukon Territory | 27 |
| Saskatoon-Biggar | 28 |
| Hamilton-Niagara Peninsula | 29 |
| North Shore | 30 |
| Fredericton-Oromocto | 31 |
| Northwest | 32 |
| Toronto | 33 |
| Southwest | 34 |
| Centre-du-Québec | 35 |
| Kingston-Pembroke | 36 |
| Winnipeg | 37 |
| Cariboo | 38 |
| Cape Breton | 39 |
| Edmundston-Woodstock | 40 |
| Saguenay-Lac-Saint-Jean | 41 |
| Kitchener-Waterloo-Barrie | 42 |
| Laurentides | 43 |
| Southern | 44 |
| Windsor-Sarnia | 45 |
| Lanaudière | 46 |
| Outaouais | 47 |
| Parklands and North | 48 |
| Southeast | 49 |
| Campbellton-Miramichi | 50 |
| Note: The economic region of Nunavut is not included. Source: Statistics Canada, Canadian Socio-Economic Information Management System (CANSIM). |
|
| Econonic region name | Ascending order |
|---|---|
| number | |
| Stratford-Bruce Peninsula | 51 |
| Montérégie | 52 |
| London | 53 |
| Regina-Moose Mountain | 54 |
| Montréal | 55 |
| Interlake | 56 |
| Northwest Territories | 57 |
| Chaudière-Appalaches | 58 |
| Ottawa | 59 |
| Laval | 60 |
| Muskoka-Kawarthas | 61 |
| Annapolis Valley | 62 |
| Capitale-Nationale (Quebec) | 63 |
| Bas-Saint-Laurent | 64 |
| Swift Current-Moose Jaw | 65 |
| West Coast-Northern Peninsula-Labrador | 66 |
| Côte-Nord and Nord-du-Québec | 67 |
| Yorkton-Melville | 68 |
| Note: The economic region of Nunavut is not included. Source: Statistics Canada, Canadian Socio-Economic Information Management System (CANSIM). |
|
References
Morissette, R., Y. Lu and H. Qiu. 2013. Worker Reallocation in Canada. Analytical Studies Branch Research Paper Series, no. 348. Statistics Canada Catalogue no. 11F0019M. Ottawa: Statistics Canada.
Morissette, R., W. Ci and G. Schellenberg. 2016. Hiring and Layoff Rates by Economic Region of Residence: Data Quality, Concepts and Methods. Analytical Studies: Methods and References, no. 001. Statistics Canada Catalogue no. 11-633-X. Ottawa: Statistics Canada.
OECD (Organization for Economic Cooperation and Development). 2009. "How Do Industry, Firm and Worker Characteristics Shape Job and Worker Flows?" In OECD Employment Outlook 2009, Chapter 2. p. 117−163. Paris: OECD Publishing.
- Date modified: