
Infographic: Canadian Internet Use and e-Commerce in Canada

Archived Content
Information identified as archived is provided for reference, research or recordkeeping purposes. It is not subject to the Government of Canada Web Standards and has not been altered or updated since it was archived. Please "contact us" to request a format other than those available.
Release date: November 19, 2014
Description for Infographic: Canadian Internet Use and e-Commerce in Canada
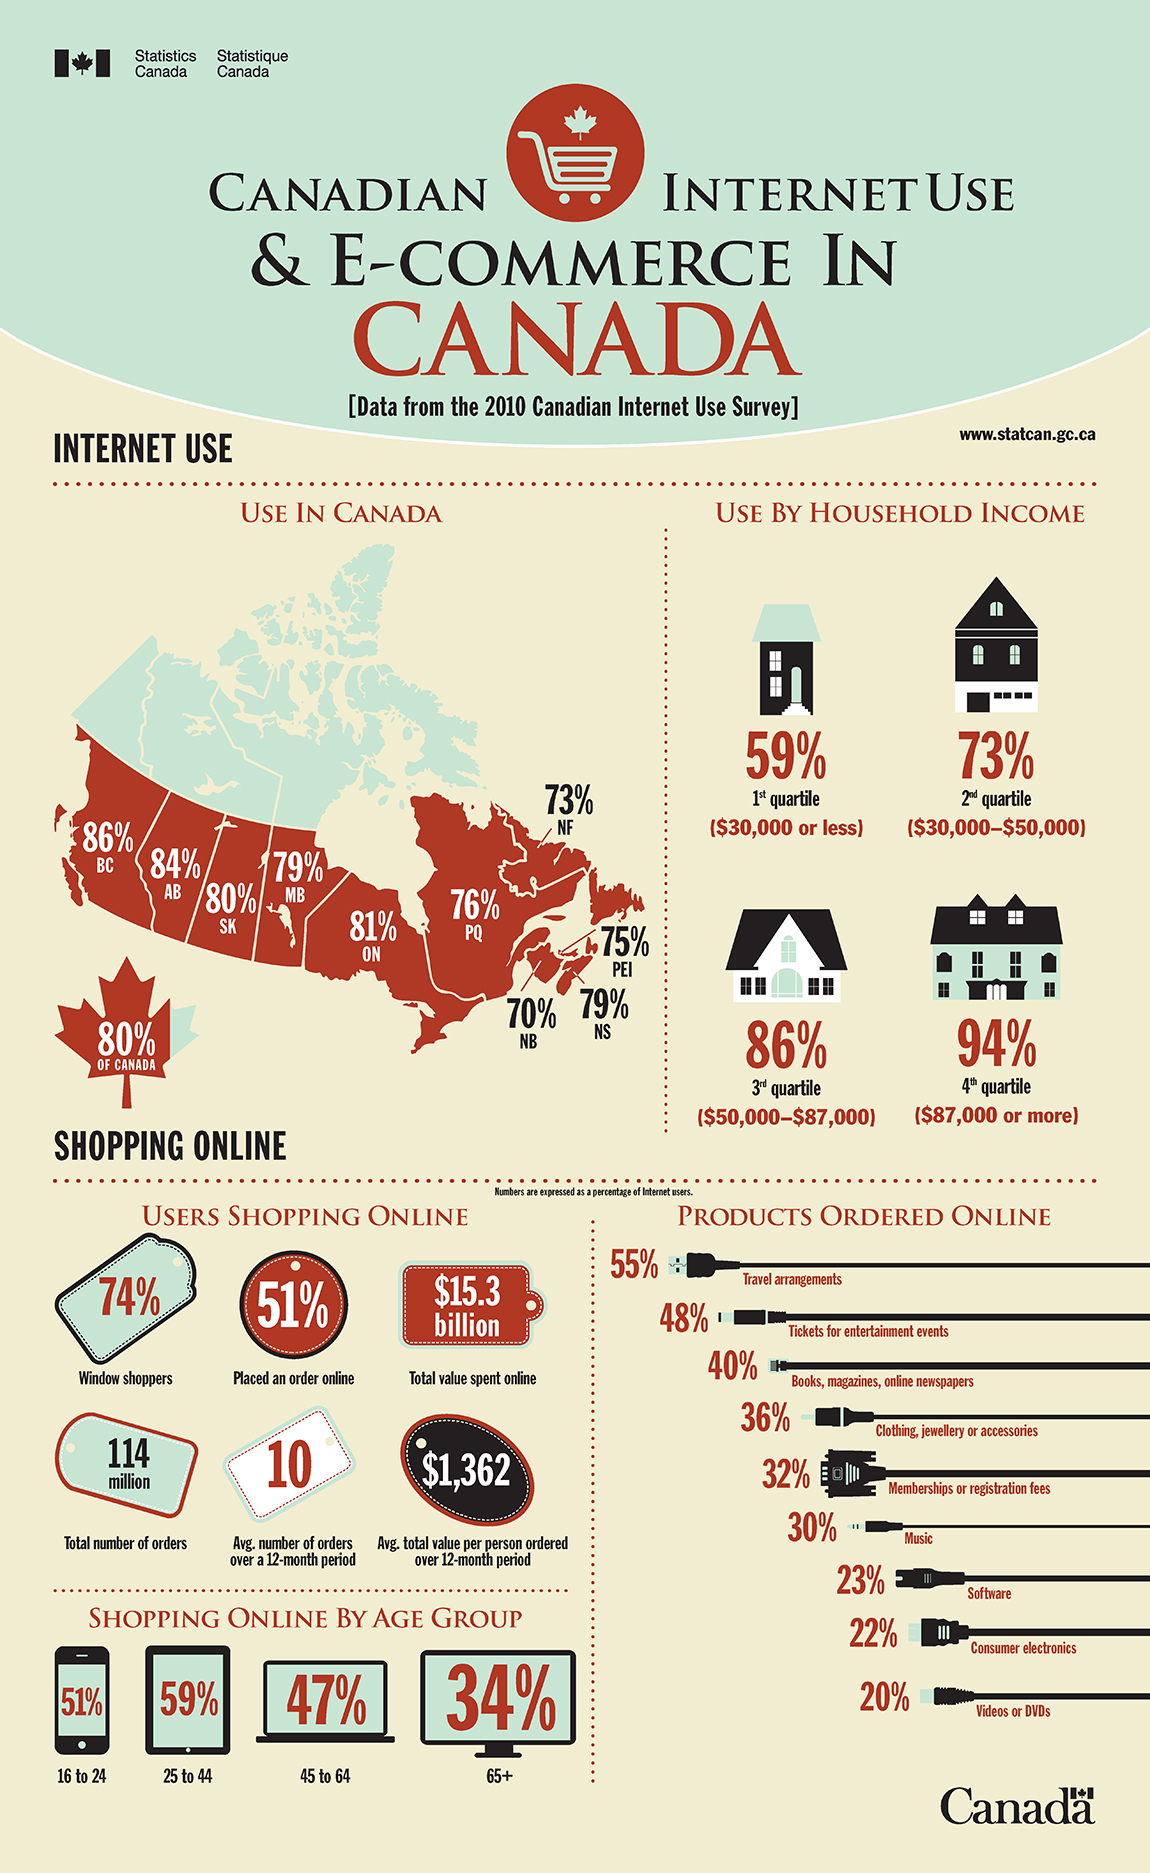
Data from the 2010 Canadian Internet Use Survey
| Province | % |
|---|---|
| * Numbers are expressed as a percentage of Internet users. | |
| British Columbia | 86 |
| Alberta | 84 |
| Saskatchewan | 80 |
| Manitoba | 79 |
| Ontario | 81 |
| Quebec | 76 |
| Newfoundland and Labrador | 73 |
| Prince Edward Island | 75 |
| New Brunswick | 70 |
| Nova Scotia | 79 |
| Canada | 80 |
| Users Online Shopping | Usage |
|---|---|
| * Numbers are expressed as a percentage of Internet users. | |
| Window shoppers | 74% |
| Placed an order online | 51% |
| Total value spent online | 15.3 billion |
| Total number of orders | 114 million |
| Average number of orders over a 12-month period | 10 |
| Average total value ordered per person over 12-month period | $1,362 |
| Age | % |
|---|---|
| * Numbers are expressed as a percentage of Internet users. | |
| 16 to 24 | 51 |
| 25 to 44 | 59 |
| 45 to 64 | 47 |
| 65+ | 34 |
| Salary | % |
|---|---|
| * Numbers are expressed as a percentage of Internet users. | |
| 1st quartile ($30,000 or less) | 59 |
| 2nd quartile ($30,000 to $50,000) | 73 |
| 3rd quartile ($50,000 to $87,000) | 86 |
| 4th quartile ($87,000 or more) | 94 |
| Types of products | % of Internet users |
|---|---|
| * Numbers are expressed as a percentage of Internet users. | |
| Travel arrangements | 55 |
| Tickets for entertainment events | 48 |
| Books, magazines, online newspapers | 40 |
| Clothing, jewellery or accessories | 36 |
| Memberships or registration fees | 32 |
| Music | 30 |
| Software | 23 |
| Consumer electronics | 22 |
| Videos or DVDs | 20 |
- Date modified: