
Infographic: 2015, Household spending in Canada

Archived Content
Information identified as archived is provided for reference, research or recordkeeping purposes. It is not subject to the Government of Canada Web Standards and has not been altered or updated since it was archived. Please "contact us" to request a format other than those available.
Description for Infographic: 2015, Household spending in Canada
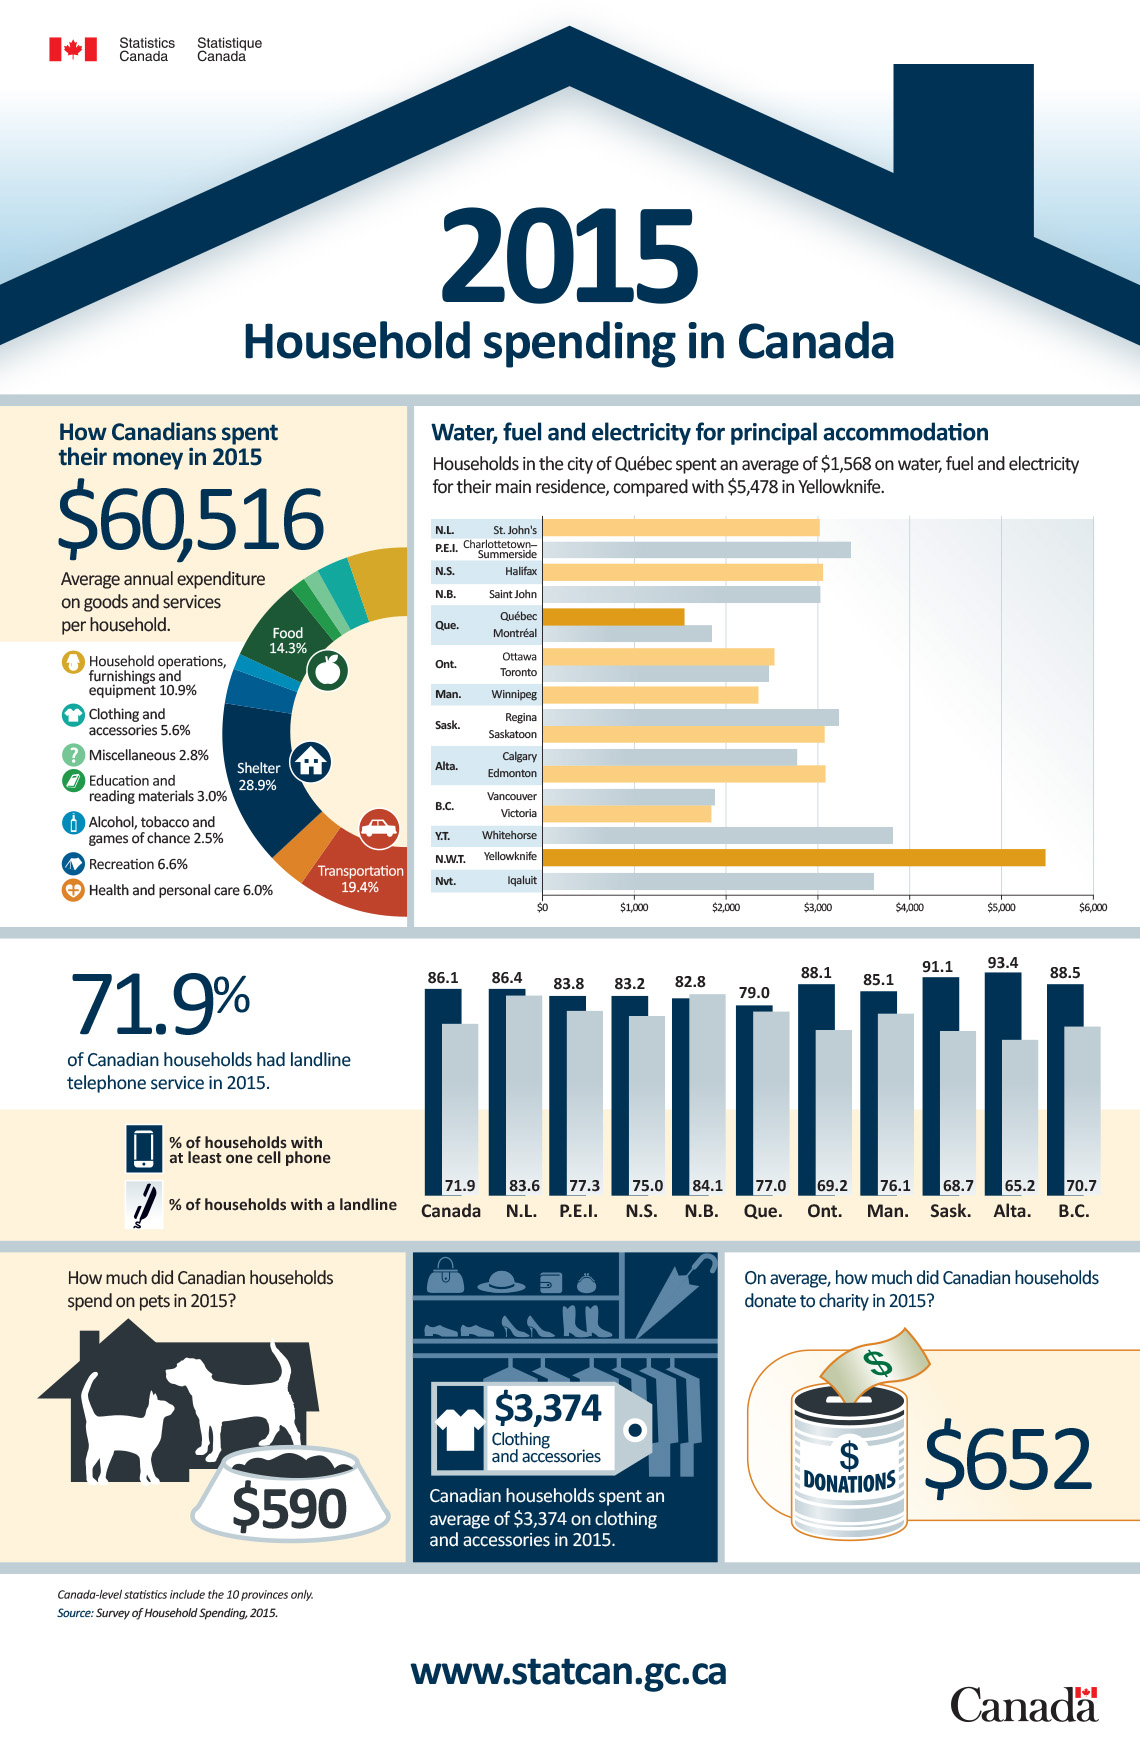
How Canadians spent their money in 2015
$60,516. Average annual expenditure on goods and services per household.
The following table shows the shares of total household spending on goods and services represented by some common spending categories.
| Categories | Share of total spending on goods and services |
|---|---|
| Household operations, furnishings and equipment | 10.9% |
| Clothing and accessories | 5.6% |
| Miscellaneous | 2.8% |
| Education and reading materials | 3.0% |
| Alcohol, tobacco and games of chance | 2.5% |
| Recreation | 6.6% |
| Health and personal care | 6.0% |
The top three household expenditures were:
- Shelter (28.9%)
- Transportation (19.4%)
- Food (14.3%)
Water, fuel and electricity for principal accommodation
Households in Québec spent an average of $1,568 on water, fuel and electricity for their main residence, compared with $5,478 in Yellowknife.
The following table shows the expenditures on water, fuel and electricity in some Canadian cities.
| Province | City | Expenditure |
|---|---|---|
| Newfoundland and Labrador | St. John's | $3,005 |
| Prince Edward Island | Charlottetown-Summerside | $3,351 |
| Nova Scotia | Halifax | $3,037 |
| New Brunswick | Saint John | $3,011 |
| Quebec | Québec | $1,568 |
| Quebec | Montréal | $1,851 |
| Ontario | Ottawa | $2,510 |
| Ontario | Toronto | $2,439 |
| Manitoba | Winnipeg | $2,331 |
| Saskatchewan | Regina | $3,227 |
| Saskatchewan | Saskatoon | $3,065 |
| Alberta | Calgary | $2,762 |
| Alberta | Edmonton | $3,072 |
| British Columbia | Vancouver | $1,871 |
| British Columbia | Victoria | $1,851 |
| Yukon | Whitehorse | $3,810 |
| Northwest Territories | Yellowknife | $5,478 |
| Nunavut | Iqaluit | $3,582 |
71.9% of Canadian households had landline telephone service in 2015.
The following table shows the percentage of households with at least one cell phone and households with landline services by province in 2015.
| Province | % of households with at least one cell phone | % of households with landline services |
|---|---|---|
| Canada | 86.1% | 71.9% |
| Newfoundland and Labrador | 86.4% | 83.6% |
| Prince Edward Island | 83.8% | 77.3% |
| Nova Scotia | 83.2% | 75.0% |
| New Brunswick | 82.8% | 84.1% |
| Quebec | 79.0% | 77.0% |
| Ontario | 88.1% | 69.2% |
| Manitoba | 85.1% | 76.1% |
| Saskatchewan | 91.1% | 68.7% |
| Alberta | 93.4% | 65.2% |
| British Columbia | 88.5% | 70.7% |
Did you know?
- Canadian households spent an average of $590 on pets in 2015.
- Canadian households spent an average of $3,374 on clothing and accessories in 2015.
- On average, Canadian households donated $652 to charity in 2015.
Footnote: Canada-level statistics include the 10 provinces only.
Source: Survey of Household Spending, 2015
- Date modified: