
How Canadians spent their money in 2016

Archived Content
Information identified as archived is provided for reference, research or recordkeeping purposes. It is not subject to the Government of Canada Web Standards and has not been altered or updated since it was archived. Please "contact us" to request a format other than those available.
Release date: December 13, 2017
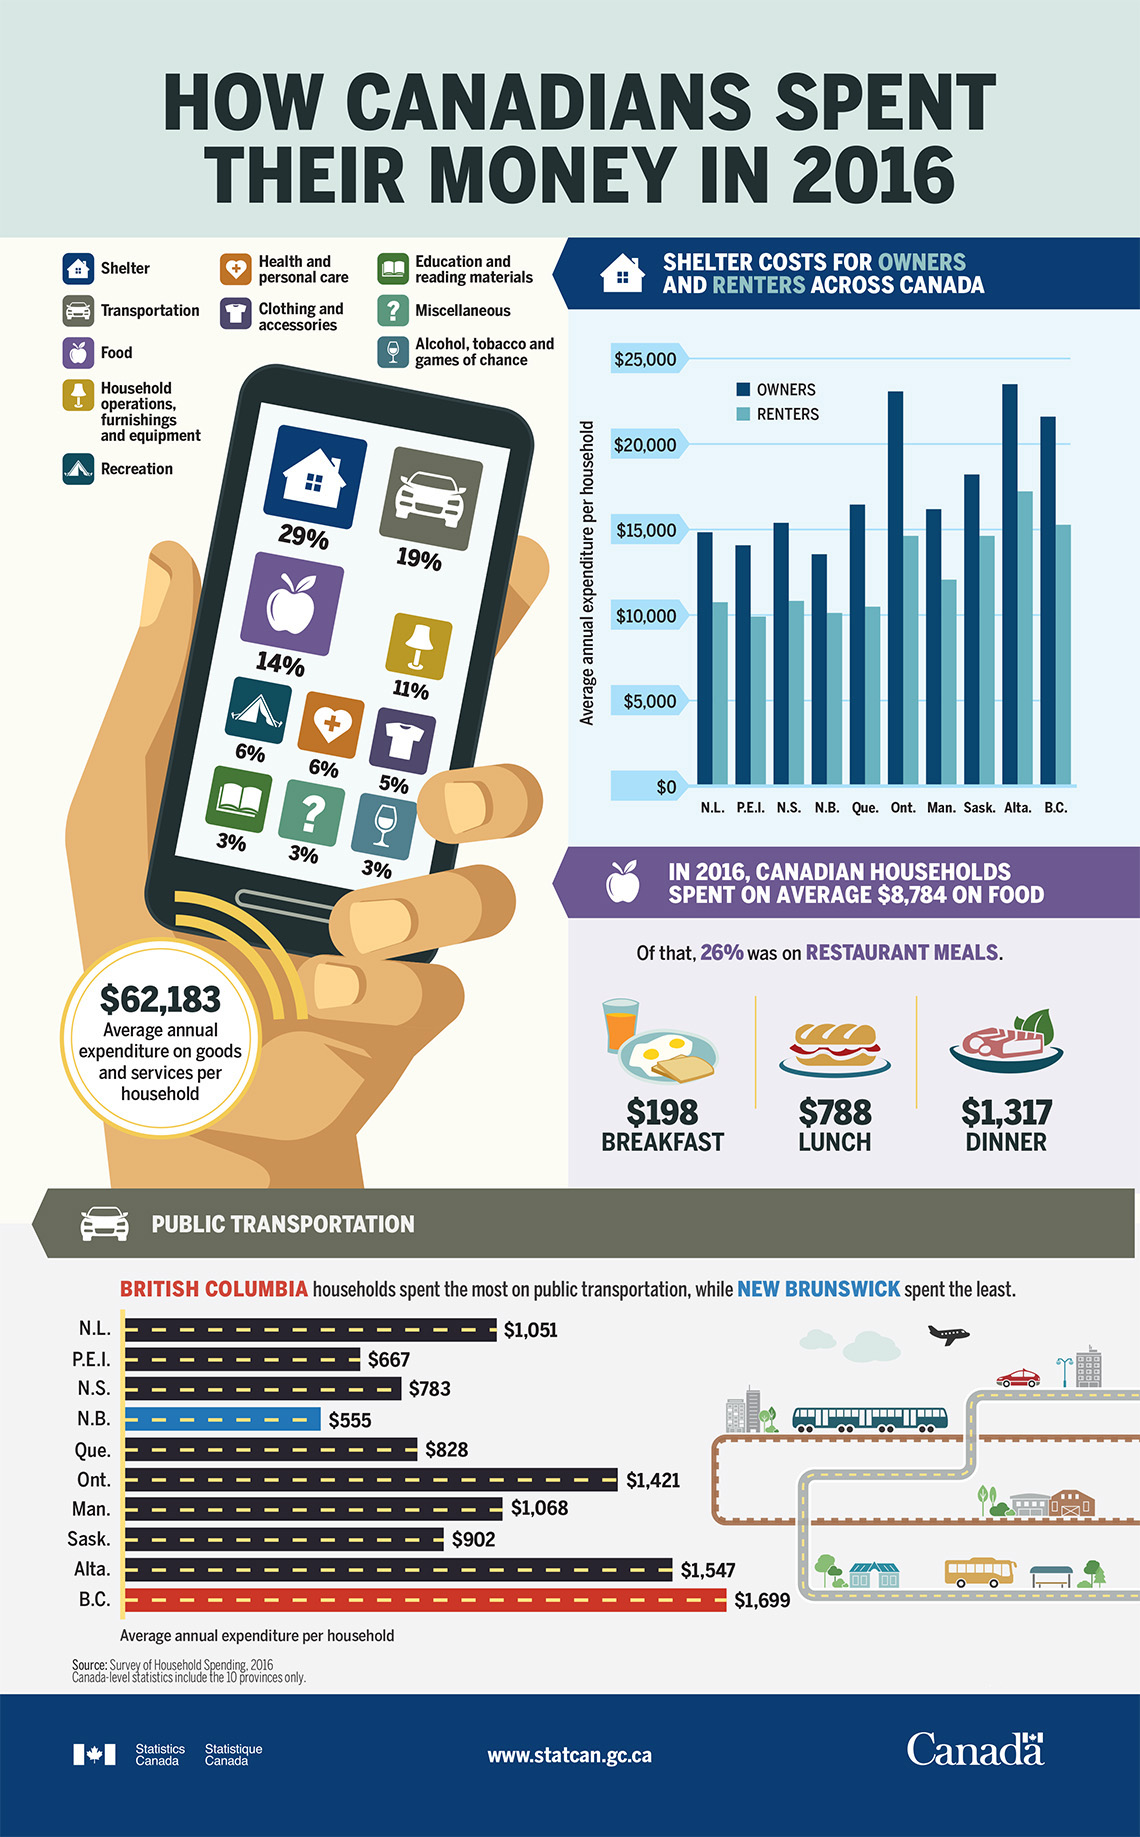
Description: How Canadians spent their money in 2016
The average annual expenditure on goods and services per household was $62,183.
| Category | Percentage |
|---|---|
| Shelter | 29% |
| Transportation | 19% |
| Food | 14% |
| Household operations, furnishings and equipment | 11% |
| Recreation | 6% |
| Health and personal care | 6% |
| Clothing and accessories | 5% |
| Education and reading materials | 3% |
| Miscellaneous | 3% |
| Alcohol, tobacco and games of chance | 3% |
Shelter costs for owners and renters across Canada
| Province | Average annual expenditure per household | |
|---|---|---|
| Owners | Renters | |
| N.L. | $14,824 | $10,751 |
| P.E.I. | $14,079 | $9,907 |
| N.S. | $15,390 | $10,826 |
| N.B. | $13,556 | $10,122 |
| Que. | $16,458 | $10,487 |
| Ont. | $23,076 | $14,628 |
| Man. | $16,191 | $12,069 |
| Sask. | $18,219 | $14,628 |
| Alta. | $23,499 | $17,231 |
| B.C. | $21,599 | $15,276 |
In 2016, Canadian households spent on average $8,784 on food.
Of that, 26% was on restaurant meals.
- Breakfast $198
- Lunch $788
- Dinner $1,317
Public transportation
British Columbia households spent the most on public transportation, while New Brunswick spent the least.
| Province | Average annual expenditure per household |
|---|---|
| N.L. | $1,051 |
| P.E.I. | $667 |
| N.S. | $783 |
| N.B. | $555 |
| Que. | $828 |
| Ont. | $1,421 |
| Man. | $1,068 |
| Sask. | $902 |
| Alta. | $1,547 |
| B.C. | $1,699 |
Note: Canada-level statistics include the 10 provinces only.
Source: Survey of Household Spending, 2016
- Date modified: