
Export Diversification

Archived Content
Information identified as archived is provided for reference, research or recordkeeping purposes. It is not subject to the Government of Canada Web Standards and has not been altered or updated since it was archived. Please "contact us" to request a format other than those available.
Description: Export Diversification
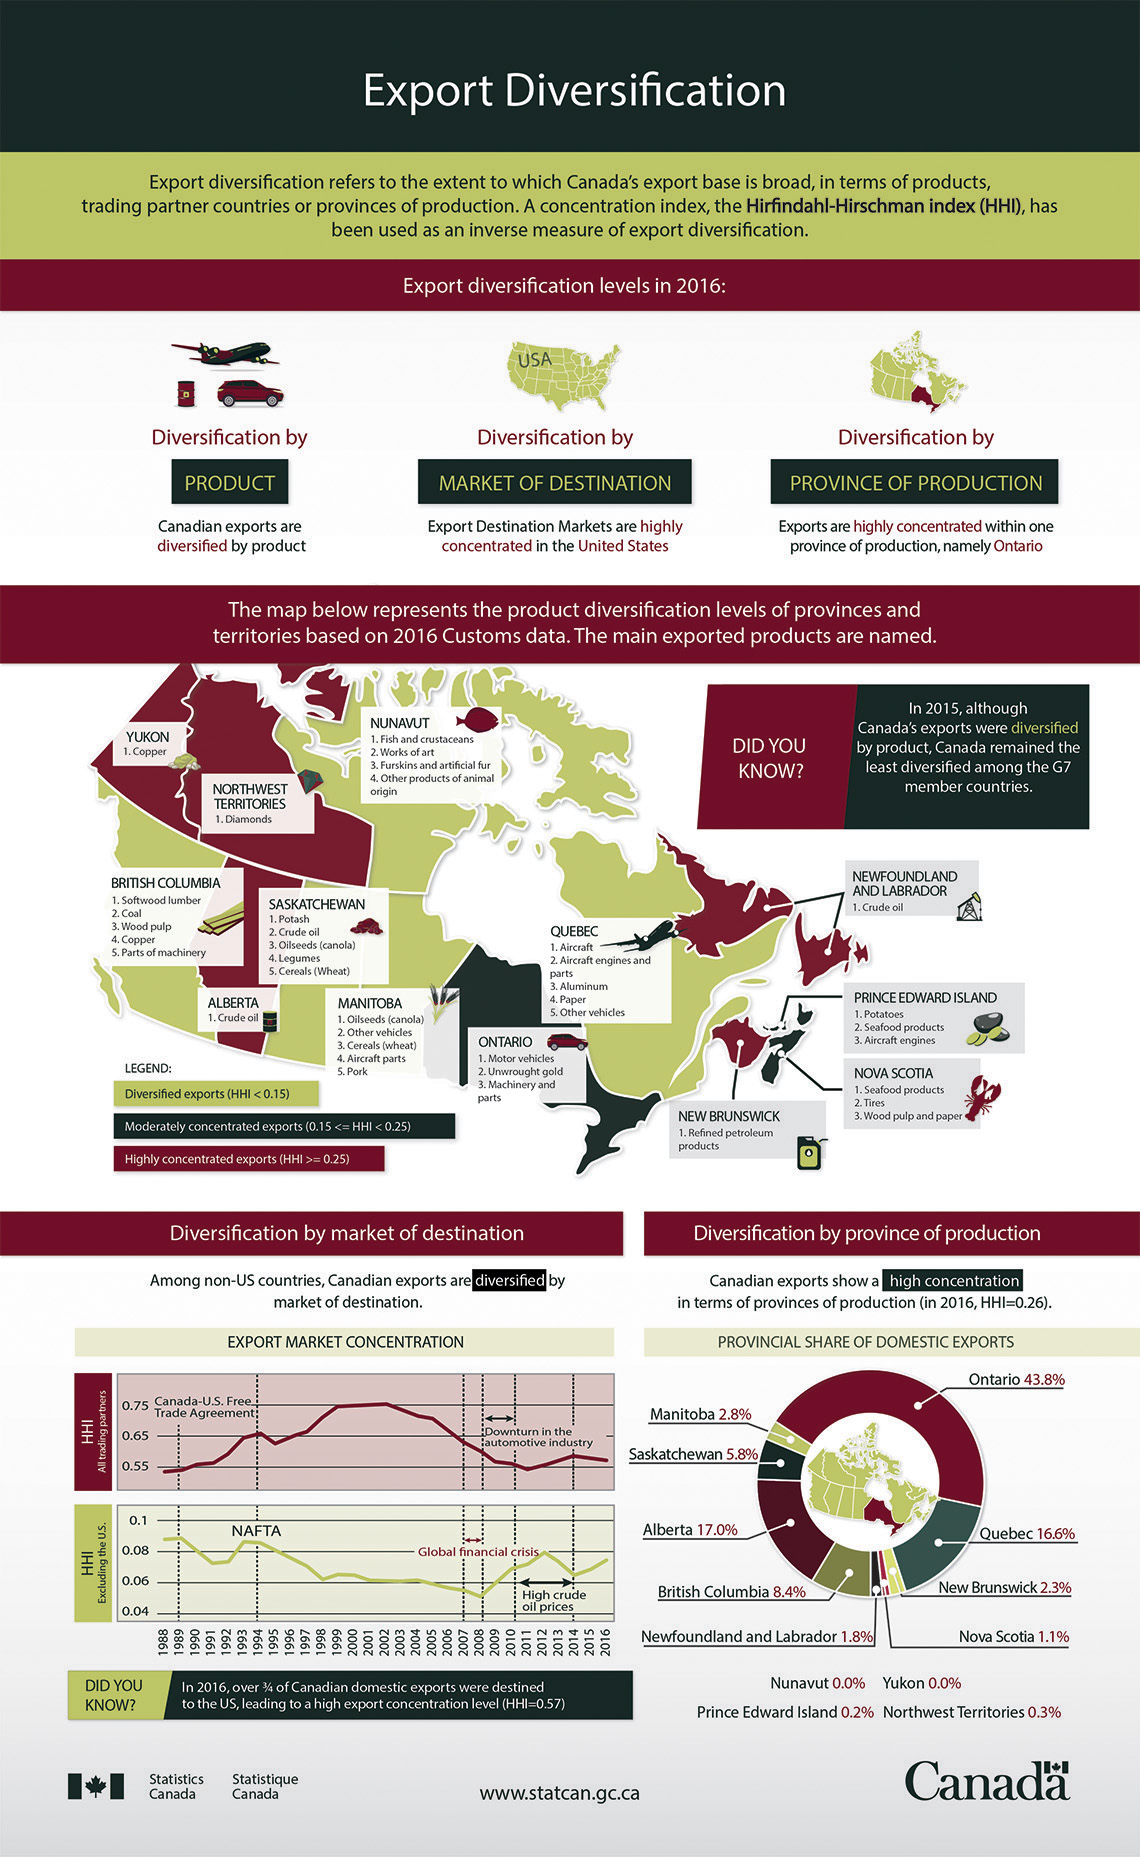
Export diversification refers to the extent to which Canada's export base is broad, in terms of products, trading partner countries or provinces of production. A concentration index, the Hirfindahl-Hirschman index (HHI), has been used as an inverse measure of export diversification.
Export diversification levels in 2016
- Diversification by product
- Canadian exported products are diversified by product
- Diversification by market of destination
- Export Destination Markets are highly concentrated in the United States
- Diversification by province of production
- Exports are highly concentrated within one province of production, namely Ontario
Diversification by product
The map below represents the product diversification levels of provinces and territories based on 2016 Customs data. The main exported products are named.
Newfoundland and Labrador
- Crude oil
Prince Edward Island
- Potatoes
- Seafood products
- Aircraft engines
Nova Scotia
- Seafood products
- Tires
- Wood pulp and paper
New Brunswick
- Refined petroleum products
Quebec
- Aircraft
- Aircraft engines and parts
- Aluminum
- Paper
- Other vehicles
Ontario
- Motor vehicles
- Unwrought gold
- Machinery and parts
Manitoba
- Oilseeds (canola)
- Other vehicles
- Cereals (wheat)
- Aircraft parts
- Pork
Saskatchewan
- Potash
- Crude oil
- Oilseeds (canola)
- Legumes
- Cereals (wheat)
Alberta
- Crude oil
British Columbia
- Softwood lumber
- Coal
- Wood pulp
- Copper
- Parts of machinery
Yukon
- Copper
Northwest Territories
- Diamonds
Nunavut
- Fish and crustaceans
- Works of art
- Furskin and artificial fur
- Other products of animal origin
| Geography | HHI |
|---|---|
| Newfoundland and Labrador | 0.44 |
| Prince Edward Island | 0.17 |
| Nova Scotia | 0.17 |
| New Brunswick | 0.34 |
| Quebec | 0.05 |
| Ontario | 0.17 |
| Manitoba | 0.06 |
| Saskatchewan | 0.13 |
| Alberta | 0.45 |
| British Columbia | 0.12 |
| Yukon | 0.92 |
| Northwest Territories | 1.00 |
| Nunavut | 0.09 |
Notes: Source: Canadian domestic export concentration, Canada, provinces and territories, annual (CANSIM Table 228-0082) |
|
Did you know?
In 2015, although Canada's export products were diversified by product, Canada remained the least diversified among the G7 member countries.
Diversification by market of destination
Among non-US countries, Canadian exports are diversified by market of destination.
| Reference year | HHI - All trading partners | HHI - Excluding the U.S. |
|---|---|---|
| 1988 | 0.55 | 0.09 |
| 1989 | 0.55 | 0.09 |
| 1990 | 0.57 | 0.08 |
| 1991 | 0.57 | 0.07 |
| 1992 | 0.6 | 0.07 |
| 1993 | 0.65 | 0.08 |
| 1994 | 0.66 | 0.08 |
| 1995 | 0.63 | 0.08 |
| 1996 | 0.65 | 0.07 |
| 1997 | 0.67 | 0.07 |
| 1998 | 0.72 | 0.06 |
| 1999 | 0.75 | 0.06 |
| 2000 | 0.75 | 0.06 |
| 2001 | 0.75 | 0.06 |
| 2002 | 0.75 | 0.06 |
| 2003 | 0.74 | 0.06 |
| 2004 | 0.72 | 0.06 |
| 2005 | 0.71 | 0.06 |
| 2006 | 0.67 | 0.06 |
| 2007 | 0.63 | 0.05 |
| 2008 | 0.6 | 0.05 |
| 2009 | 0.57 | 0.06 |
| 2010 | 0.56 | 0.07 |
| 2011 | 0.54 | 0.07 |
| 2012 | 0.56 | 0.08 |
| 2013 | 0.58 | 0.07 |
| 2014 | 0.59 | 0.06 |
| 2015 | 0.58 | 0.07 |
| 2016 | 0.57 | 0.07 |
Notable events:
Source: Canadian domestic export concentration, Canada, provinces and territories, annual (CANSIM Table 228-0082) |
||
Did you know?
In 2016, over ¾ of Canadian domestic exports were destined to the US, leading to a high export concentration level (HHI=0.57)
Diversification by province of production
Canadian exports show a high concentration in terms of provinces of production (in 2016, HHI=0.26).
| Geography | Provincial share of domestic exports |
|---|---|
| Newfoundland and Labrador | 1.80% |
| Prince Edward Island | 0.20% |
| Nova Scotia | 1.10% |
| New Brunswick | 2.30% |
| Quebec | 16.60% |
| Ontario | 43.80% |
| Manitoba | 2.80% |
| Saskatchewan | 5.80% |
| Alberta | 17.00% |
| British Columbia | 8.40% |
| Yukon | 0.00% |
| Northwest Territories | 0.30% |
| Nunavut | 0.00% |
| Source: Canadian International Merchandise Trade ProgramFootnote 1 | |
- Date modified: