
Bank of Canada's preferred measures of core inflation
Description: Bank of Canada's preferred measures of core inflation
Consumer Price Index
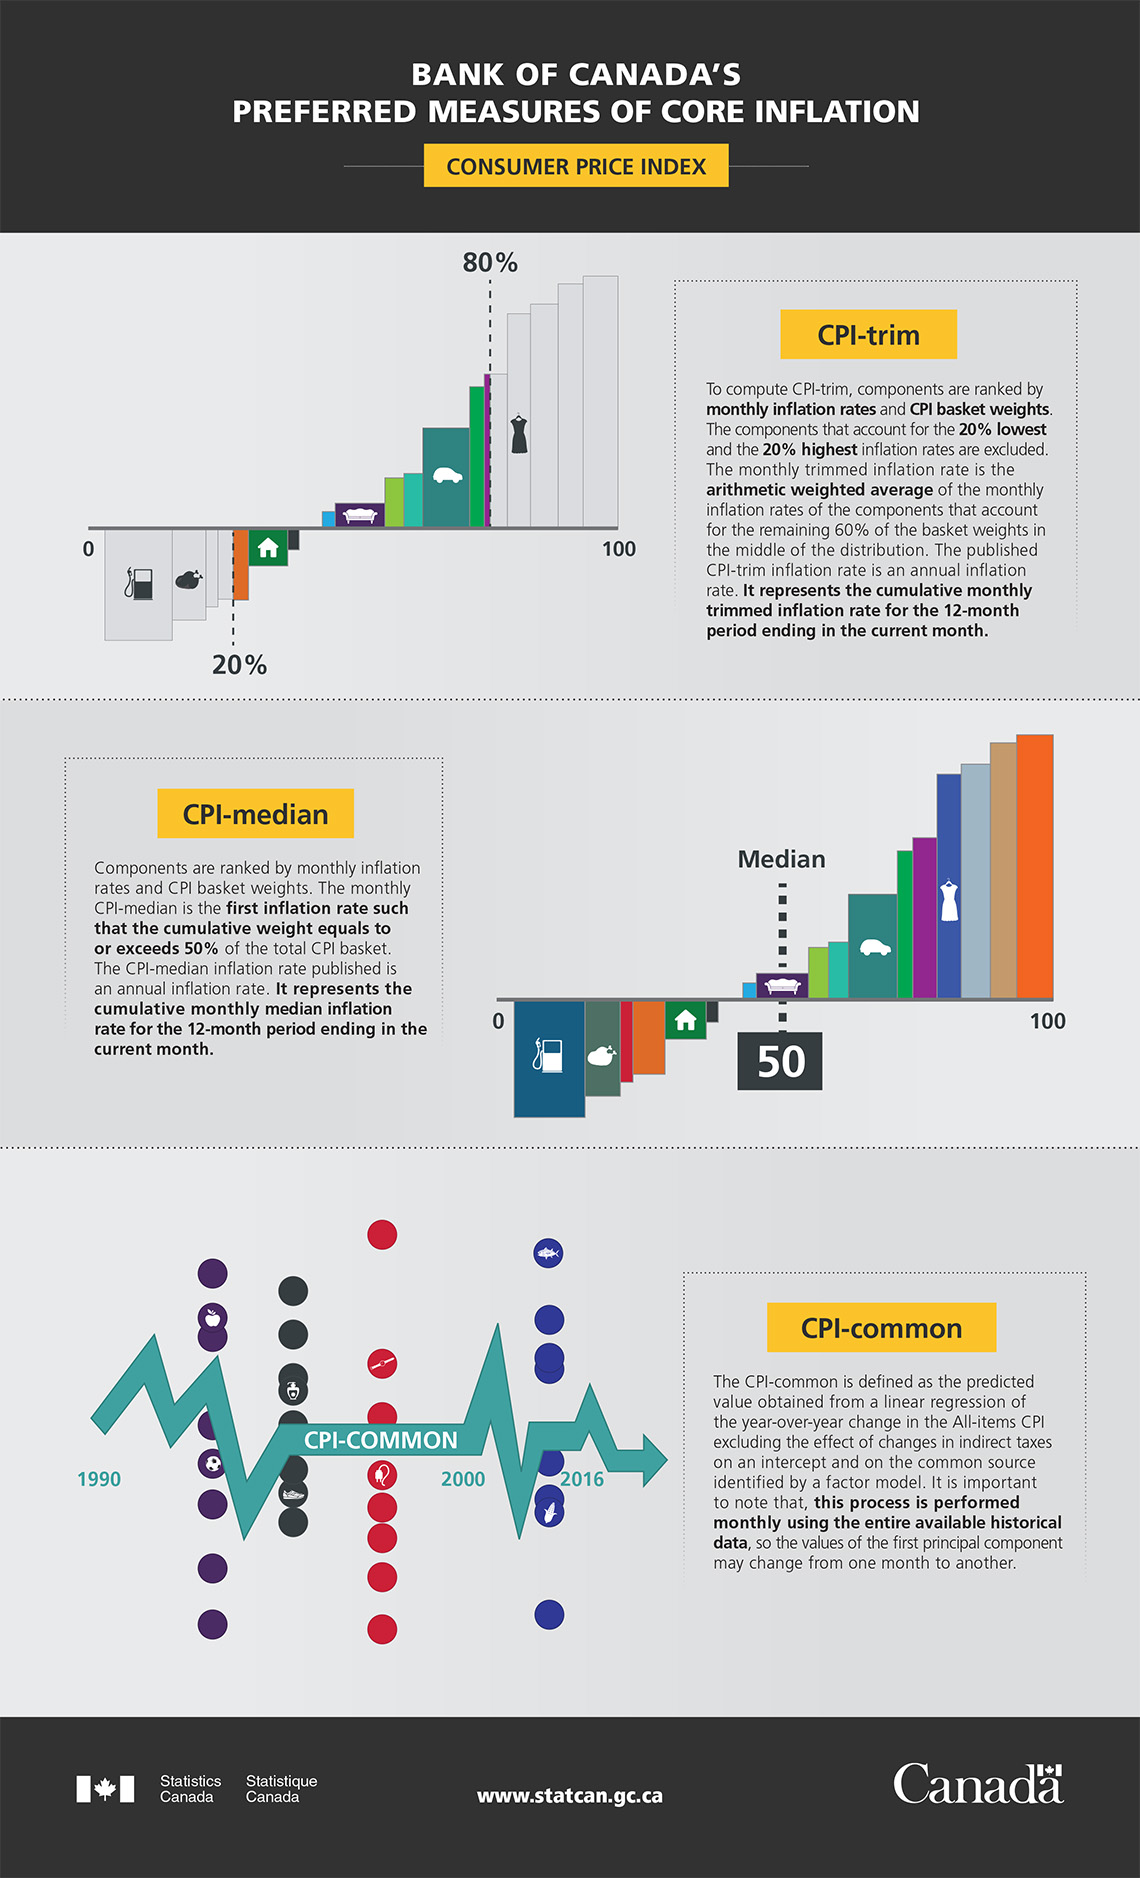
There are three images on the page that visually represent the Bank of Canada's three preferred measures of core inflation.
First image is of CPI-trim
The image shows a bar graph with an x-axis from 0-100 percent, representing the cumulative weight of the CPI basket contents ordered on the graph. From the zero point to the 20% the bars are greyed-out, to signify the left tail of the distribution of price changes. From the 20% point to the 80%, the bars are coloured, and show various items found in the CPI basket, such as housing, furniture and transportation. Over the 80% mark again the bars are greyed-out, to signify the right tail of the distribution of price changes.
The definition of CPI-trim
To compute CPI-trim, components are ranked by monthly inflation rates and CPI basket weights. The components that account for the 20% lowest and the 20% highest inflation rates are excluded. The monthly trimmed inflation rate is the arithmetic weighted average of the monthly inflation rates of the components that account for the remaining 60% of the basket weights in the middle of the distribution. The published CPI-trim inflation rate is an annual inflation rate. It represents the cumulative monthly trimmed inflation rate for the 12-month period ending in the current month.
Second image is of CPI-median
The image shows a bar graph with an x-axis from 0-100 percent, representing the cumulative weight of the CPI basket contents ordered on the graph. All the bars are coloured and show various items found in the CPI basket, such as housing, furniture and transportation. At the halfway point of the graph, 50 per cent, there is a dotted line to show the median point.
The definition of the CPI-median
Components are ranked by monthly inflation rates and CPI basket weights. The monthly CPI-median is the first inflation rate such that the cumulative weight equals to or exceeds 50% of the total CPI basket. The CPI-median inflation rate published is an annual inflation rate. It represents the cumulative monthly median inflation rate for the 12-month period ending in the current month.
Third image is of CPI-common
The image shows a line graphic with several peaks and valleys over the years, from 1990 through infinity, and crosses vertical arrangements of colorful bubbles containing various items found in the CPI basket, such as fruit, jewelry, and fish. The line has a label indicating "CPI-COMMON", to signify that it is the common element through time.
The definition of the CPI-common
The CPI-common is defined as the predicted value obtained from a linear regression of the year-over-year change in the All-items CPI excluding the effect of changes in indirect taxes on an intercept and on the common source identified by a factor model. It is important to note that, this process is performed monthly using the entire available historical data, so the values of the common source component may change from one month to another.
- Date modified: