
Changing profile of stay-at-home parents

Archived Content
Information identified as archived is provided for reference, research or recordkeeping purposes. It is not subject to the Government of Canada Web Standards and has not been altered or updated since it was archived. Please "contact us" to request a format other than those available.

The face of the typical Canadian stay-at-home parent has changed over the last four decades. It's gotten a little more masculine. In 1976, stay-at-home fathers accounted for approximately 1 in 70 of all Canadian families with a stay-at-home parent. By 2015, the proportion had risen to about 1 in 10.
Over the past few decades, as the educational attainment and labour-force participation of women have increased, so has the involvement of men in child care. The proportion of dual-earner families has also been on the rise. This has had an effect on the proportion of single-earner families with a stay-at-home parent.
Among single-earner families, the situation of a non-working parent varied depending on whether the mother or the father was the sole earner in the family. Among families where the father was the sole earner, most mothers were out of the labour force as a stay-at-home parent. In contrast, among families where the mother was the only working parent, fathers were less likely to be stay-at-home parents, and were, instead, likely to be looking for work, attending school or permanently unable to work.
The number of stay-at-home mothers as a proportion of non-working mothers has declined over time. In 1976, more than 9 in 10 non-working mothers in a single-earner family were stay-at-home parents. The rest were either unemployed, students or permanently unable to work. In 2015, almost three-quarters of non-working mothers were stay-at-home moms, while one-quarter were either unemployed, students or unable to work.
Among families where the mother was the only earner, approximately one-third of the fathers were stay-at-home dads in 1976 (32%) and 2015 (35%), while about half were unemployed in 1976 (52%) and 2015 (49%).
The number of single-earner families with a stay-at-home parent dropped from 1,487,000 in 1976 to 493,000 in 2015. Families with a stay-at-home mother declined by 1,025,000, whereas those with a stay-at-home father increased by 32,000. The number of stay-at-home mothers declined in almost every year between 1976 and 2015. The majority of the decline occurred between 1976 and 1991 (851,000, compared with 174,000 between 1991 and 2015).
Conversely, even though the number of single-earner families with a stay-at-home father increased, the growth was not constant. There were declines during periods of expanding employment following an economic slowdown (for example, 1984, 1994 to 1997, 2003 to 2005, and 2010).
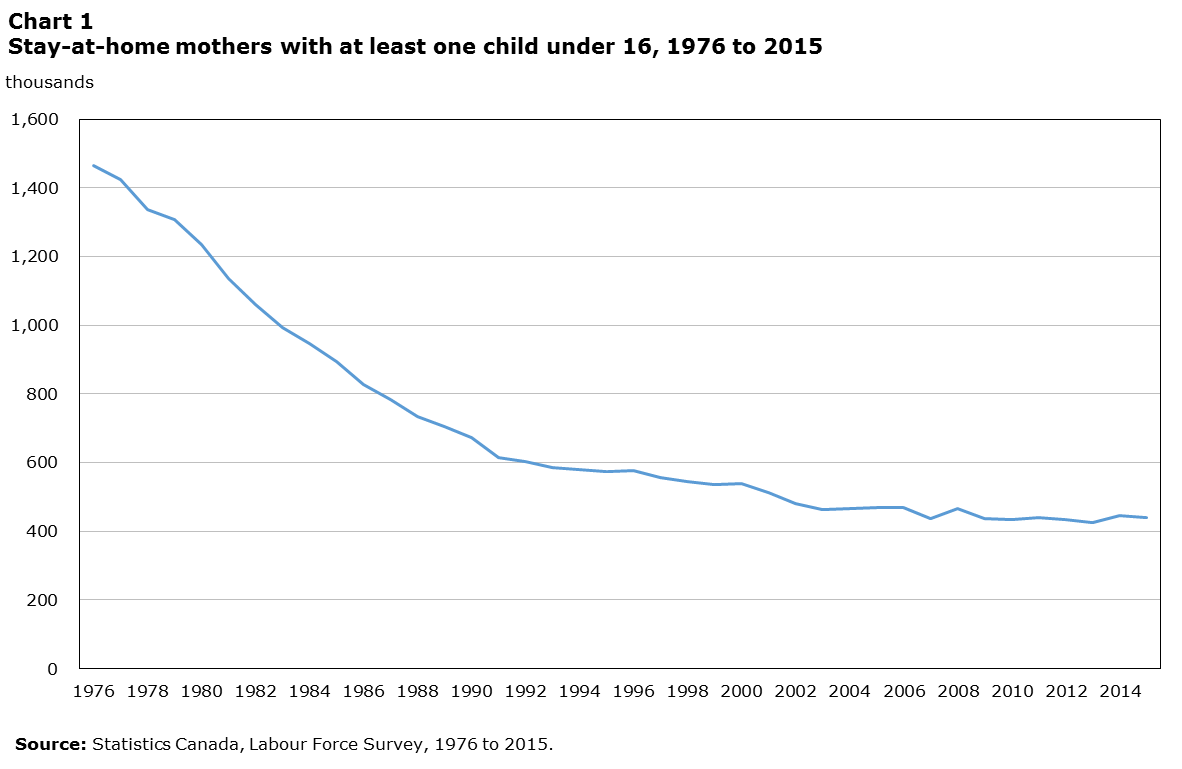
Description for Chart 1
| Year | Stay-at-home mothers |
|---|---|
| Source: Statistics Canada, Labour Force Survey, 1976 to 2015. | |
| 1976 | 1,465.7 |
| 1977 | 1,423.2 |
| 1978 | 1,336.4 |
| 1979 | 1,307.2 |
| 1980 | 1,235.3 |
| 1981 | 1,134.8 |
| 1982 | 1,059.8 |
| 1983 | 993.5 |
| 1984 | 945.1 |
| 1985 | 892.8 |
| 1986 | 826.8 |
| 1987 | 784.5 |
| 1988 | 734.0 |
| 1989 | 704.5 |
| 1990 | 672.3 |
| 1991 | 614.3 |
| 1992 | 602.9 |
| 1993 | 585.5 |
| 1994 | 579.2 |
| 1995 | 574.9 |
| 1996 | 577.9 |
| 1997 | 557.4 |
| 1998 | 543.4 |
| 1999 | 535.5 |
| 2000 | 539.9 |
| 2001 | 513.0 |
| 2002 | 480.4 |
| 2003 | 461.9 |
| 2004 | 465.3 |
| 2005 | 468.5 |
| 2006 | 467.7 |
| 2007 | 438.0 |
| 2008 | 467.1 |
| 2009 | 436.8 |
| 2010 | 433.1 |
| 2011 | 439.1 |
| 2012 | 432.9 |
| 2013 | 426.3 |
| 2014 | 445.7 |
| 2015 | 440.5 |
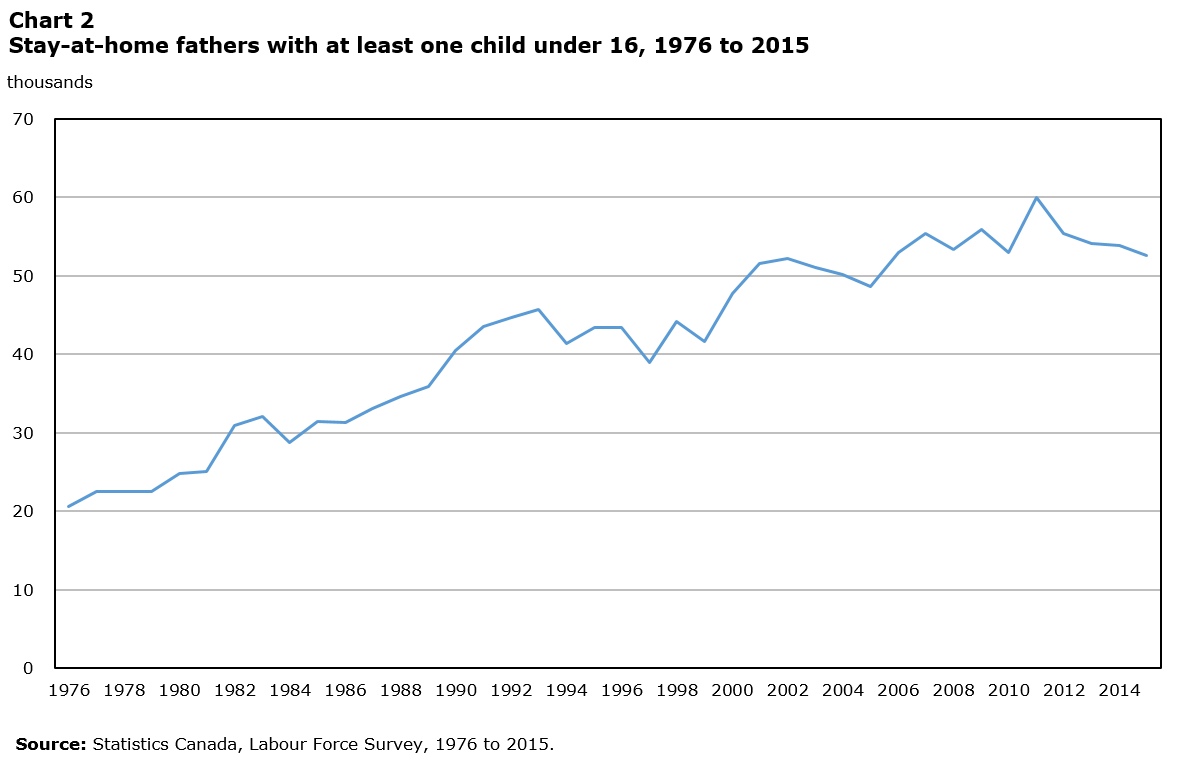
Description for Chart 2
| Year | Stay-at-home fathers |
|---|---|
| Source: Statistics Canada, Labour Force Survey, 1976 to 2015. | |
| 1976 | 20.6 |
| 1977 | 22.6 |
| 1978 | 22.5 |
| 1979 | 22.6 |
| 1980 | 24.8 |
| 1981 | 25.1 |
| 1982 | 30.9 |
| 1983 | 32.1 |
| 1984 | 28.7 |
| 1985 | 31.4 |
| 1986 | 31.3 |
| 1987 | 33.1 |
| 1988 | 34.6 |
| 1989 | 35.9 |
| 1990 | 40.4 |
| 1991 | 43.5 |
| 1992 | 44.6 |
| 1993 | 45.7 |
| 1994 | 41.3 |
| 1995 | 43.4 |
| 1996 | 43.5 |
| 1997 | 38.9 |
| 1998 | 44.2 |
| 1999 | 41.6 |
| 2000 | 47.7 |
| 2001 | 51.5 |
| 2002 | 52.2 |
| 2003 | 51.0 |
| 2004 | 50.1 |
| 2005 | 48.7 |
| 2006 | 52.9 |
| 2007 | 55.3 |
| 2008 | 53.4 |
| 2009 | 55.8 |
| 2010 | 53.0 |
| 2011 | 60.0 |
| 2012 | 55.4 |
| 2013 | 54.2 |
| 2014 | 53.8 |
| 2015 | 52.6 |
Alberta had the highest proportion of stay-at-home parents
Families with a stay-at-home parent accounted for 53% of couple families with children in 1976 and 18% in 2015. In 1976, Quebec had the highest proportion of couple families with a stay-at-home parent (59%). Ontario had the lowest proportion (49%).
Since 1976, the proportion of families with a stay-at-home parent has declined in all provinces. However, the magnitude of the decrease was not the same across provinces. In 2015, Alberta had the highest proportion of couple families with a stay-at-home parent (25%), while Quebec had the lowest proportion (11%). This suggests that the proportion of families with a stay-at-home parent decreased faster in Quebec than in any other province.
The decline in the number of stay-at-home parents was a result of a decrease in the number of stay-at-home mothers. The number of stay-at-home fathers increased in all provinces, albeit at different rates. In 1976, the Atlantic Provinces had the highest proportion of stay-at-home fathers (3% of families with a stay-at-home parent), while other provinces had proportions below 2%.
From 1976 to 2015, the proportion of stay-at-home fathers rose by 15 percentage points in the Atlantic Provinces and by 13 percentage points in Quebec. The proportion in Alberta increased by 6 percentage points. This widened the provincial gap in the proportion of stay-at-home fathers. In 2015, the Atlantic Provinces still had the highest proportion of families with a stay-at-home father (18% of families with a stay-at-home parent), followed by Quebec (13%). At the opposite end of the spectrum, Alberta had the lowest proportion (6%).

Description for Chart 3
| Province | Stay-at-home father (earning mother) | ||
|---|---|---|---|
| 1976 | 2015 | 1976 to 2015 | |
| Atlantic Provinces | 2.8 | 18.1 | 15.3 |
| Quebec | 1.2 | 14.4 | 13.2 |
| British Columbia | 1.7 | 12.0 | 10.3 |
| Manitoba | 1.3 | 11.9 | 10.6 |
| Canada | 1.4 | 10.7 | 9.3 |
| Ontario | 1.2 | 10.1 | 8.9 |
| Saskatchewan | 1.6 | 8.8 | 7.2 |
| Alberta | 0.7 | 6.2 | 5.5 |
| 1. Earning mother. Note: Atlantic Provinces have been grouped together because of sample size issues. Source: Statistics Canada, Labour Force Survey, 1976 and 2015. |
|||
Demographics of stay-at-home parents
Stay-at-home mothers were slightly younger on average than both single-earner mothers and mothers who were part of a dual-earner couple. The average age of stay-at-home mothers was 36 years, compared with 40 years for single-earner mothers and 39 years for mothers who were in a dual-earner couple.
Correspondingly, stay-at-home mothers were more likely to have younger children, compared with mothers in the workforce. In 2015, 59% of stay-at-home mothers had at least one child under the age of 5 at home, while this was the case for 36% of single-earner mothers and 42% of dual-earner mothers. Furthermore, stay-at-home mothers had more children on average, and they were almost twice as likely as single- and dual-earner mothers to have more than two children under the age of 16.
Stay-at-home mothers were also more likely to have lower levels of education. In 2015, 38% of them had a high-school diploma or less, compared with 27% of single-earner mothers and 19% of dual-earner mothers.
Unlike stay-at-home mothers, stay-at-home fathers were on average older (45 years old) than fathers in single-earner families (40 years old) and dual-earner families (41 years old). However, as was the case for stay-at-home mothers, stay-at-home fathers were more likely to have lower levels of education. In 2015, 42% had a high school diploma or less. In comparison, 31% of single-earner fathers and 25% of dual-earner fathers had similar levels of education.
| Age | Mother | Father | ||||
|---|---|---|---|---|---|---|
| Stay-at-home | Single-earner | Dual-earner | Stay-at-home | Single-earner | Dual-earner | |
| average | ||||||
| Average age | 36.3 | 40.2 | 38.5 | 44.5 | 39.5 | 40.9 |
| Average number of children under 16 | 2.1 | 1.7 | 1.8 | 1.7 | 2.1 | 1.8 |
| percentage | ||||||
| More than two children under 16 | 26.3 | 13.5 | 14.0 | 13.5 | 26.3 | 14.0 |
| At least one child under 5 at home | 59.2 | 36.2 | 41.5 | 36.2 | 59.2 | 41.4 |
| All children 5 to 15 | 40.8 | 63.8 | 58.5 | 63.8 | 40.8 | 58.6 |
| Education | ||||||
| Less than high school | 11.1 | 6.6 | 3.2 | 11.9 | 9.6 | 5.4 |
| High school graduation | 27.2 | 20.2 | 15.5 | 30.0 | 21.8 | 20.0 |
| College/trades | 30.7 | 36.3 | 38.2 | 35.8 | 34.8 | 40.4 |
| University degree | 31.0 | 36.9 | 43.2 | 22.3 | 33.8 | 34.3 |
| Source: Statistics Canada, Labour Force Survey, 2015. | ||||||
Definitions
Stay-at-home parent: a person in a couple family with at least one child under the age of 16 at home, who did not have a job or business, was not looking for work, was not attending school, and was not permanently unable to work during the survey reference week; parents on maternity or parental leave are not considered to be stay-at-home parents if they have a job to which they will return—they are considered employed and absent from work.
References
Jaumotte, F. 2004. Labour Force Participation of Women: Empirical Evidence on the Role of Policy and Other Determinants in OECD Countries. OECD Economic Studies. No. 37. 2003/2. p. 51–108.
Marshall, K. 1998. Stay-at-home dads. Perspectives on Labour and Income. Vol. 10, no. 1. Spring. Statistics Canada Catalogue no. 75-001-XPE. p. 9–15.
Milligan, K. 2014. “The Road to egalitaria: Sex differences in employment for parents of young children.” CESifo Economic Studies. Vol. 60, no. 2. June. p. 257–279.
Uppal, S. 2015. Employment patterns of families with children. Insights on Canadian Society. Statistics Canada Catalogue no. 75-006-X, June.
Contact information
To enquire about the concepts, methods or data quality of this release, contact Sharanjit Uppal (Sharanjit.Uppal@canada.ca; 613-854-3482), Labour Statistics Division.
- Date modified: