
A portrait of Canadian youth

Archived Content
Information identified as archived is provided for reference, research or recordkeeping purposes. It is not subject to the Government of Canada Web Standards and has not been altered or updated since it was archived. Please "contact us" to request a format other than those available.
February 7, 2018
- Who are Canadian youth and where do they live?
- What are Canadian youth doing?
- How are Canadian youth doing?
- What's next?
Today's youth are unlike any generation before!
They are more:
- Diverse
- Connected
- Socially Engaged
- Educated
Many youth are reaping the benefits but others face challenges such as...
- finding a full time job
- social exclusion
- cyberbullying
- mental health challenges and addiction
- higher risk of being obese
Also important to think about today's youth within the entire life course.
It is important to remember that today's youth will become Canada's future parents, prime-age workers, and seniors. Their early experiences and vulnerabilities can shape their outcomes later in life.
Who are Canadian youth and where do they live?
Canadian youth in numbers
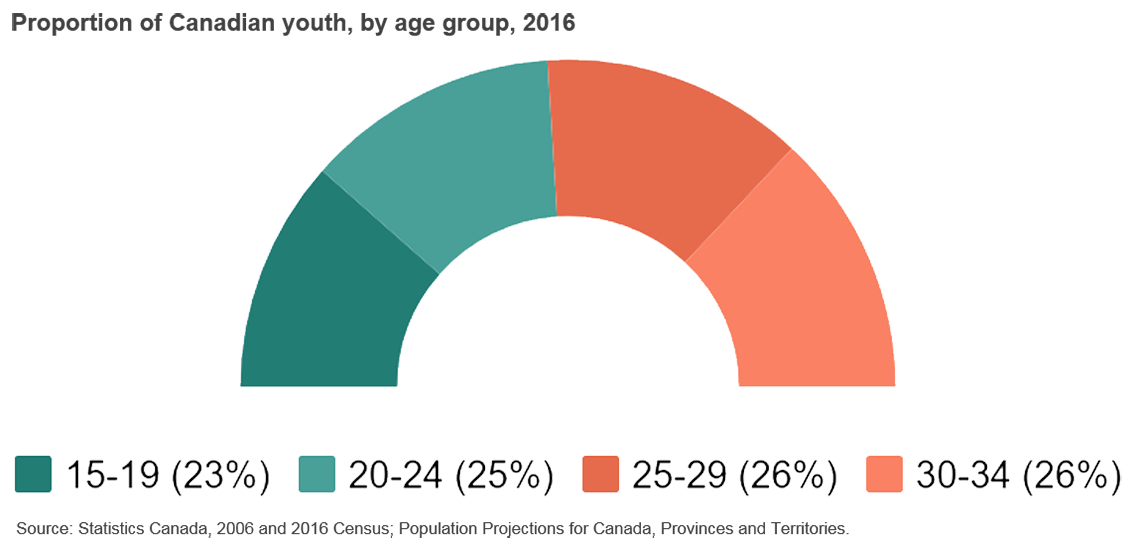
There are 9 million youth across the country, aged 15 to 34
Description for Chart 1
| Age category | Percentage of youth |
|---|---|
| Source: Statistics Canada, 2006 and 2016 Census; Population Projections for Canada, Provinces and Territories. | |
| 15 to 19 | 23 |
| 20 to 24 years | 25 |
| 25 to 29 years | 26 |
| 30 to 34 years | 26 |
They currently represent – and will continue to represent – about one-quarter of the country's population...compared with well over one-third in the 1970s.
Between 2006 and 2016, the number of youth aged 25 to 34 increased the most. The number of youth aged 15 to 19 declined.
Did you know?
Similar to other countries, Canada's youth represent a smaller share of the population than in the past.
Source: Statistics Canada, 2006 and 2016 Census; Population Projections for Canada, Provinces and Territories.
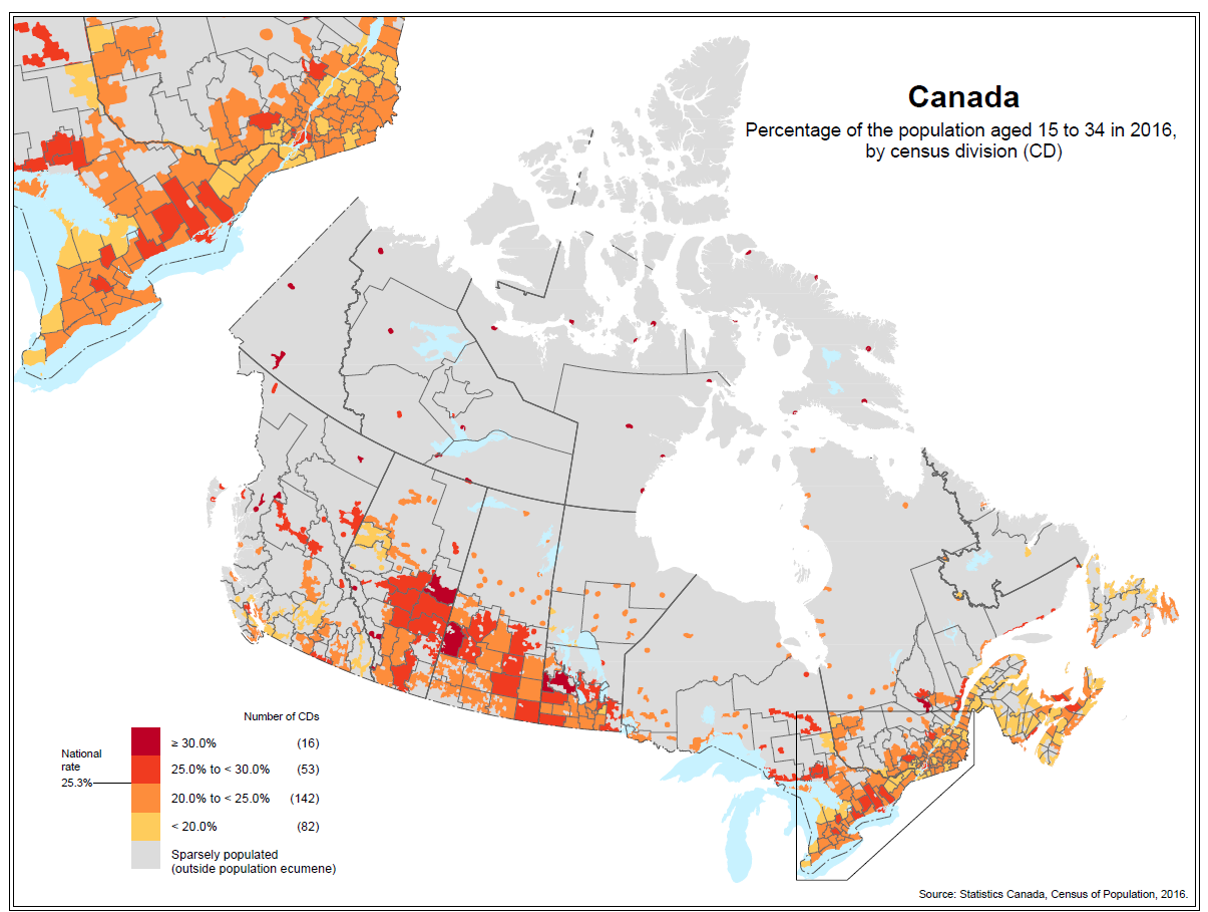
Youth's share of the population highest in Western Canada and the North
Description for Chart 2
| Census division (CD) | Percentage of population |
|---|---|
| Keewatin 00100 | 34.6 |
| Division No. 12 20100 | 34.2 |
| Region 6 00100 | 33.9 |
| Baffin 00100 | 33.7 |
| Kitikmeot 00100 | 33.6 |
| Region 1 00100 | 32.2 |
| Division No. 13 00000 | 32.0 |
| Division No. 16 00000 | 31.5 |
| Division No. 17 00000 | 31.4 |
| Region 5 00100 | 30.8 |
| Region 2 00100 | 30.7 |
| Yukon 00100 | 30.7 |
| Division No. 15 01200 | 30.5 |
| Le Domaine-du-Roy 00000 | 30.3 |
| Northern Rockies 00100 | 30.2 |
| Kitimat-Stikine 00100 | 30.0 |
| Division No. 6 00000 | 29.9 |
| Division No. 7 00000 | 29.3 |
| Hastings 00000 | 29.2 |
| Division No. 11 00000 | 28.9 |
| Division No. 12 00000 | 28.8 |
| Pictou 00000 | 28.6 |
| Division No. 13 00000 | 28.4 |
| Division No. 13 00000 | 28.4 |
| Region 3 01200 | 28.3 |
| Division No. 14 00000 | 28.2 |
| Fraser-Fort George 00000 | 28.2 |
| Region 4 01200 | 28.1 |
| Division No. 2 00000 | 28.0 |
| Comox Valley 00000 | 28.0 |
| Longueuil 00000 | 28.0 |
| Division No. 16 00000 | 28.0 |
| Division No. 5 00000 | 27.9 |
| Division No. 8 00000 | 27.9 |
| Division No. 1 00000 | 27.9 |
| Division No. 4 00000 | 27.8 |
| Division No. 1 00100 | 27.7 |
| Cochrane 00000 | 27.6 |
| Dufferin 00000 | 27.5 |
| Prince Edward 00000 | 27.5 |
| Algoma 20000 | 27.3 |
| Queens 00000 | 27.3 |
| Kootenay Boundary 00000 | 27.3 |
| Division No. 14 00000 | 27.1 |
| Waterloo 00000 | 27.1 |
| Mékinac 00000 | 26.9 |
| La Haute-Côte-Nord 00000 | 26.9 |
| Montréal 00000 | 26.7 |
| Greater Sudbury / Grand Sudbury 00000 | 26.7 |
| Division No. 18 00100 | 26.7 |
| Skeena-Queen Charlotte 00100 | 26.6 |
| Division No. 15 00000 | 26.5 |
| Sudbury 00000 | 26.2 |
| Peace River 00100 | 26.0 |
| Stikine 03300 | 26.0 |
| Peterborough 00000 | 26.0 |
| Durham 00000 | 25.9 |
| Division No. 10 00000 | 25.7 |
| Minganie--Le Golfe-du-Saint-Laurent 00000 | 25.7 |
| Thérèse-De Blainville 00000 | 25.7 |
| Maria-Chapdelaine 00000 | 25.6 |
| Division No. 19 00100 | 25.6 |
| Saint John 00000 | 25.4 |
| Frontenac 00000 | 25.3 |
| Canada 20000 | 25.3 |
| Les Laurentides 20000 | 25.1 |
| Charlevoix-Est 00000 | 25.0 |
| Division No. 16 01100 | 25.0 |
| Bulkley-Nechako 00100 | 25.0 |
| Division No. 10 00000 | 25.0 |
| Division No. 15 00000 | 24.8 |
| Mount Waddington 00100 | 24.8 |
| Division No. 3 00000 | 24.7 |
| Lennox and Addington 00000 | 24.7 |
| Division No. 5 00000 | 24.6 |
| Northumberland 00000 | 24.5 |
| Haldimand-Norfolk 20000 | 24.4 |
| Division No. 2 00000 | 24.4 |
| Muskoka 20000 | 24.4 |
| Division No. 4 00000 | 24.4 |
| Central Kootenay 00000 | 24.4 |
| Laval 00000 | 24.4 |
| Division No. 2 00000 | 24.3 |
| Cariboo 00100 | 24.3 |
| Rouville 00000 | 24.3 |
| Kenora 21100 | 24.2 |
| Okanagan-Similkameen 00000 | 24.2 |
| Division No. 8 00000 | 24.1 |
| Division No. 8 00000 | 24.1 |
| Division No. 6 00000 | 24.1 |
| Division No. 20 00000 | 24.1 |
| Peel 00000 | 24.0 |
| Division No. 3 00100 | 24.0 |
| Kamouraska 00000 | 23.9 |
| Parry Sound 00000 | 23.9 |
| Colchester 00000 | 23.9 |
| L'Assomption 00000 | 23.8 |
| Sunshine Coast 00100 | 23.8 |
| Gatineau 00000 | 23.8 |
| Central Coast 01200 | 23.8 |
| Le Haut-Richelieu 00000 | 23.8 |
| Richmond 00000 | 23.8 |
| Westmorland 00000 | 23.8 |
| Division No. 1 00000 | 23.7 |
| Chatham-Kent 00000 | 23.7 |
| Wellington 00000 | 23.7 |
| La Vallée-de-l'Or 00000 | 23.7 |
| Halton 00000 | 23.6 |
| La Vallée-du-Richelieu 00000 | 23.6 |
| Maskinongé 00000 | 23.5 |
| Roussillon 20000 | 23.4 |
| Renfrew 00000 | 23.4 |
| Powell River 00100 | 23.4 |
| Division No. 3 00000 | 23.4 |
| Division No. 2 00000 | 23.4 |
| Division No. 11 00000 | 23.4 |
| L'Islet 00000 | 23.3 |
| Leeds and Grenville 00000 | 23.2 |
| Middlesex 20000 | 23.2 |
| Nicolet-Yamaska 00000 | 23.1 |
| Lévis 00000 | 23.1 |
| Acton 00000 | 23.1 |
| Division No. 4 00000 | 23.0 |
| Marguerite-D'Youville 00000 | 23.0 |
| York 00000 | 23.0 |
| D'Autray 00000 | 23.0 |
| La Haute-Yamaska 00000 | 23.0 |
| Brome-Missisquoi 00000 | 22.9 |
| Huron 00000 | 22.9 |
| Columbia-Shuswap 00000 | 22.9 |
| Kawartha Lakes 00000 | 22.8 |
| Papineau 00000 | 22.7 |
| Les Moulins 00000 | 22.7 |
| Beauce-Sartigan 00000 | 22.7 |
| Matawinie 00000 | 22.7 |
| Division No. 9 00100 | 22.6 |
| Division No. 22 00100 | 22.6 |
| Queens 00000 | 22.5 |
| Charlevoix 00000 | 22.5 |
| Brant 20000 | 22.5 |
| Division No. 10 00000 | 22.4 |
| Thunder Bay 00000 | 22.4 |
| Le Haut-Saint-François 00000 | 22.3 |
| Hamilton 00000 | 22.3 |
| Division No. 6 00000 | 22.3 |
| L'Île-d'Orléans 00000 | 22.2 |
| Division No. 17 00100 | 22.2 |
| Division No. 7 00000 | 22.1 |
| Rouyn-Noranda 00000 | 22.1 |
| Stormont, Dundas and Glengarry 00000 | 22.0 |
| Division No. 7 00000 | 22.0 |
| Le Saguenay-et-son-Fjord 00000 | 22.0 |
| Pierre-De Saurel 00000 | 22.0 |
| Toronto 00000 | 22.0 |
| Drummond 00000 | 21.9 |
| Le Rocher-Percé 00000 | 21.9 |
| Montcalm 00000 | 21.9 |
| Niagara 00000 | 21.9 |
| Division No. 18 00100 | 21.9 |
| Manitoulin 00100 | 21.9 |
| Division No. 11 01100 | 21.9 |
| Halifax 00000 | 21.8 |
| Perth 00000 | 21.8 |
| Division No. 23 01200 | 21.6 |
| Shawinigan 00000 | 21.5 |
| Division No. 17 00100 | 21.5 |
| Haliburton 00000 | 21.5 |
| Arthabaska 00000 | 21.5 |
| Les Appalaches 00000 | 21.5 |
| Charlotte 00000 | 21.5 |
| Lac-Saint-Jean-Est 00000 | 21.3 |
| Les Collines-de-l'Outaouais 00000 | 21.3 |
| Antigonish 00000 | 21.3 |
| Inverness 00000 | 21.3 |
| Les Basques 00000 | 21.3 |
| North Okanagan 00000 | 21.3 |
| Coaticook 00000 | 21.2 |
| Capital 20000 | 21.2 |
| Prince 00000 | 21.2 |
| Division No. 9 00000 | 21.2 |
| Division No. 4 00000 | 21.1 |
| Mirabel 00000 | 21.0 |
| La Tuque 00000 | 21.0 |
| Témiscamingue 00000 | 21.0 |
| Nipissing 00000 | 20.9 |
| Abitibi 00000 | 20.9 |
| Division No. 14 00000 | 20.9 |
| Kings 00000 | 20.9 |
| Division No. 1 00000 | 20.9 |
| Division No. 9 00000 | 20.8 |
| Oxford 00000 | 20.8 |
| Montmagny 00000 | 20.8 |
| La Haute-Gaspésie 00000 | 20.8 |
| Les Sources 00000 | 20.7 |
| Kings 00000 | 20.7 |
| Division No. 3 00000 | 20.7 |
| Québec 00000 | 20.7 |
| Central Okanagan 00000 | 20.7 |
| Rainy River 00000 | 20.5 |
| Portneuf 00000 | 20.4 |
| Nord-du-Québec 01100 | 20.4 |
| Sept-Rivières--Caniapiscau 00000 | 20.4 |
| Division No. 5 00000 | 20.4 |
| Le Granit 00000 | 20.4 |
| Elgin 00000 | 20.4 |
| La Vallée-de-la-Gatineau 20000 | 20.3 |
| Antoine-Labelle 00000 | 20.3 |
| La Nouvelle-Beauce 00000 | 20.3 |
| Joliette 00000 | 20.2 |
| Division No. 11 00000 | 20.1 |
| Le Val-Saint-François 00000 | 20.1 |
| Cowichan Valley 00000 | 20.0 |
| Division No. 6 00000 | 19.9 |
| Lanark 00000 | 19.8 |
| Greater Vancouver 00000 | 19.8 |
| Lotbinière 00000 | 19.8 |
| Division No. 12 00000 | 19.8 |
| Essex 00000 | 19.7 |
| Squamish-Lillooet 00100 | 19.7 |
| Manicouagan 00000 | 19.6 |
| Les Pays-d'en-Haut 00000 | 19.6 |
| Témiscouata 00000 | 19.5 |
| Argenteuil 00000 | 19.5 |
| Cumberland 00000 | 19.4 |
| Division No. 21 01100 | 19.3 |
| Les Jardins-de-Napierville 00000 | 19.3 |
| Yarmouth 00000 | 19.2 |
| Bécancour 00000 | 19.2 |
| Thompson-Nicola 00000 | 19.1 |
| Victoria 00000 | 19.1 |
| Madawaska 00000 | 19.1 |
| Grey 00000 | 19.0 |
| Sunbury 00000 | 19.0 |
| Pontiac 00000 | 18.9 |
| Ottawa 00000 | 18.9 |
| Memphrémagog 00000 | 18.8 |
| Simcoe 00000 | 18.8 |
| Division No. 18 00100 | 18.7 |
| Fraser Valley 00000 | 18.7 |
| York 00000 | 18.7 |
| Annapolis 00000 | 18.6 |
| Restigouche 00000 | 18.6 |
| Nanaimo 00000 | 18.6 |
| Les Etchemins 00000 | 18.6 |
| Les Îles-de-la-Madeleine 00000 | 18.5 |
| Queens 00000 | 18.4 |
| Rimouski-Neigette 00000 | 18.4 |
| Division No. 5 00000 | 18.3 |
| Shelburne 00000 | 18.3 |
| Sherbrooke 00000 | 18.3 |
| Kings 00000 | 18.2 |
| Deux-Montagnes 20000 | 18.2 |
| Avignon 00000 | 18.1 |
| Bellechasse 00000 | 18.1 |
| La Rivière-du-Nord 00000 | 18.0 |
| Cape Breton 00000 | 18.0 |
| La Jacques-Cartier 00000 | 17.9 |
| Albert 00000 | 17.9 |
| La Côte-de-Beaupré 00000 | 17.9 |
| Division No. 19 00000 | 17.8 |
| Gloucester 00000 | 17.7 |
| La Matapédia 00000 | 17.7 |
| Division No. 10 00000 | 17.6 |
| Timiskaming 00000 | 17.6 |
| Bruce 00000 | 17.5 |
| Beauharnois-Salaberry 00000 | 17.5 |
| Hants 00000 | 17.4 |
| Abitibi-Ouest 00000 | 17.4 |
| Victoria 00000 | 17.4 |
| Francheville 00000 | 17.3 |
| Division No. 9 00000 | 17.1 |
| Division No. 7 00000 | 17.1 |
| La Mitis 00000 | 17.1 |
| Lunenburg 00000 | 17.1 |
| Matane 00000 | 17.1 |
| Kent 00000 | 17.1 |
| Vaudreuil-Soulanges 00000 | 17.1 |
| Les Maskoutains 00000 | 17.0 |
| L'Érable 00000 | 16.9 |
| Prescott and Russell 00000 | 16.8 |
| East Kootenay 00000 | 16.8 |
| Bonaventure 00000 | 16.8 |
| Alberni-Clayoquot 00100 | 16.6 |
| Carleton 00000 | 16.5 |
| Rivière-du-Loup 00000 | 16.2 |
| Division No. 8 00000 | 16.1 |
| Northumberland 00000 | 15.9 |
| Guysborough 00000 | 15.8 |
| Strathcona 00000 | 15.2 |
| Lambton 00000 | 15.0 |
| Le Haut-Saint-Laurent 00000 | 14.9 |
| La Côte-de-Gaspé 00000 | 14.6 |
| Digby 00000 | 14.4 |
| Robert-Cliche 00000 | 14.3 |
Description for Chart 3
| Province | Percentage of youth |
|---|---|
| Source: Statistics Canada, 2016 Census | |
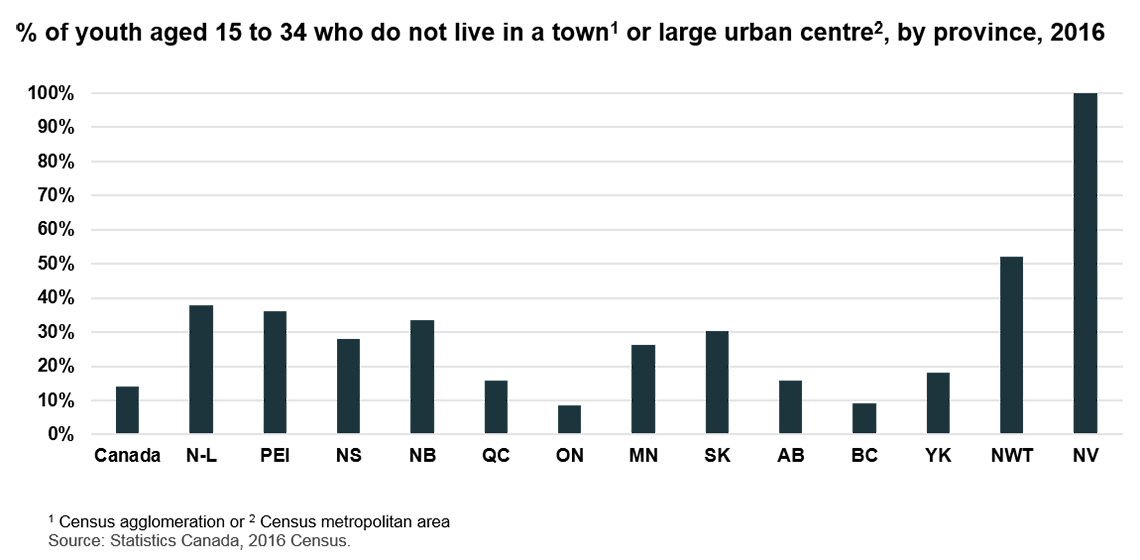
| Canada | 14.1 |
| N-L | 38.0 |
| PEI | 36.1 |
| NS | 28.1 |
| NB | 33.5 |
| QC | 15.8 |
| ON | 8.5 |
| MN | 26.3 |
| SK | 30.5 |
| AB | 15.7 |
| BC | 9.0 |
| YT | 18.0 |
| NWT | 52.0 |
| NV | 100.0 |
Youth are highly diverse...along many dimensions
In 2016, 27% of youth aged 15 to 34 identified themselves as a member of a visible minority group, compared with 13% in 1996.

Description for Chart 4
| 1996 | 2016 | |
|---|---|---|
| Sources: Statistics Canada, 1996 and 2016 Census; General Social Survey on Social Identity, 2013. | ||
| Age 15 to 34 | 13.2 | 27 |
| Age 65 or older | 5.9 | 12.6 |

Description for Chart 5
| % | |
|---|---|
| Sources: Statistics Canada, 1996 and 2016 Census; General Social Survey on Social Identity, 2013. | |
| Saguenay | 2.2 |
| Québec | 6.9 |
| Halifax | 16.6 |
| Montreal | 26.9 |
| Calgary | 35.4 |
| Vancouver | 53.6 |
| Toronto | 56.3 |
Did you know?
Almost 75% of youth have friends from another ethnic group.
In 2016, 76% of youth in Toronto were immigrants (1st generation) or had at least one parent who is an immigrant (2nd generation).

Description for Chart 6
| First generation | Second generation | Third generation or more | ||||
|---|---|---|---|---|---|---|
| Sources: Statistics Canada, 2016 Census; General Social Survey on Canadians at Work and Home, 2016; Canadian Survey on Disability, 2012 | ||||||
| Canada | 22.3% | 18.9% | 58.8% | |||
| Montréal | 25.2% | 19.0% | 55.8% | |||
| Toronto | 41.1% | 34.8% | 24.1% | |||
| Vancouver | 40.2% | 28.6% | 31.1% | |||
Description for Chart 7
| Men | Women | |||||
|---|---|---|---|---|---|---|
| Age | ||||||
| 15-24 | 25-34 | 35-54 | 15-24 | 25-34 | 35-54 | |
| Sources: Statistics Canada, 2016 Census; General Social Survey on Canadians at Work and Home, 2016; | ||||||
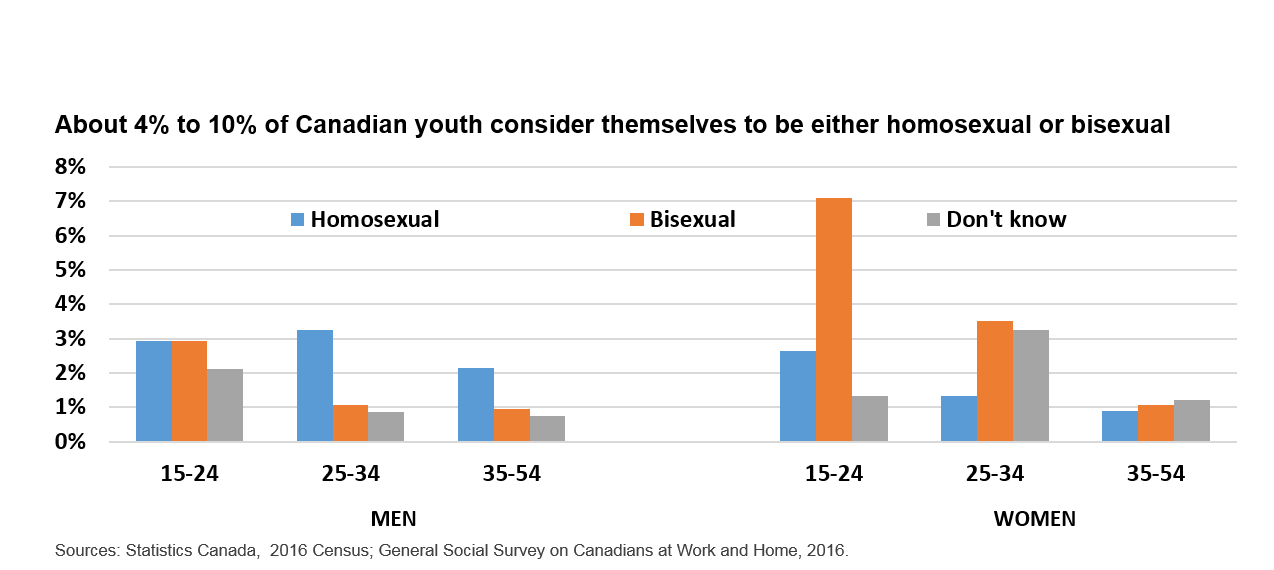
| Homosexual | 2.9% | 3.2% | 2.2% | 2.7% | 1.3% | 0.9% |
| Bisexual | 2.9% | 1.1% | 1.0% | 7.1% | 3.5% | 1.1% |
| Don't know | 2.1% | 0.9% | 0.8% | 1.3% | 3.3% | 1.2% |
433,880 youth aged 15 to 34 – or 4.8% – report that they have a disability
Sources: Statistics Canada, Canadian Survey on Disability, 2012
The number of young Indigenous people is growing
From 2006 to 2016, the number of First Nations, Métis and Inuit youth aged 15 to 34 increased by 39%, compared to just over 6% for non-Indigenous youth.

Description for Chart 8
| % | |
|---|---|
| Sources: Statistics Canada, 2006 and 2016 Census | |
| First Nations | 40.1 |
| Métis | 41.5 |
| Inuit | 24.5 |
| Non-Indigenous | 6.5 |

Description for Chart 9
| % | |
|---|---|
| Sources: Statistics Canada, 2006 and 2016 Census. | |
| Toronto | 1.0 |
| Vancouver | 3.1 |
| Canada | 5.9 |
| Edmonton | 6.9 |
| Regina | 11.1 |
| Saskatoon | 12.9 |
| Winnipeg | 14.4 |
| Thunder Bay | 17.0 |
More youth are living with their parents
In 2016, 35% of young adults, 20 to 34, were living with their parents, up from 31% in 2001. The increase was largest for youth aged 25 to 29.
| Location | Percent (%) |
|---|---|
| Source: Statistics Canada, 2001 and 2016 Census | |
| Toronto | 47.4 |
| Hamilton | 44.5 |
| Vancouver | 38.6 |
| Canada | 34.7 |
| Montréal | 33.1 |
| Calgary | 28.5 |
| Québec | 23.8 |
What are Canadian youth doing?
Youth are more connected than any other generation
- Nearly 100% of youth aged 15 to 24 use the Internet on a daily basis or own their own smartphone – broadly similar across all provinces and across all household income groups.
- More than three quarters of youth aged 15 to 34 use the Internet to follow news and current affairs – more than twice the rate among older Canadians.
- One half of youth aged 25 to 34 conduct transactions on the Internet at least weekly – almost twice that of older Canadians.
- Nearly half of 16 to 24 year olds participate in real-time discussions on the Internet, compared with less than 10% of older Canadians.

Description for Chart 10
| percent | |
|---|---|
| † reference category * significantly different from reference category Note: Includes only those that reported using the Internet. Source: Statistics Canada, General Social Survey, 2013. |
|
| 15 to 24† | 96 |
| 25 to 34 | 87* |
| 35 to 44 | 76* |
| 45 to 54 | 58* |
| 55 to 64 | 52* |
| 65+ | 36* |
But higher technology use also brings new challenges
15% of youth aged 15 to 34 said they were cyberbullied or cyberstalked in the past 5 years
Sources: Statistics Canada, General Social Survey on Canadian at Work and Home, 2016; General Social Survey on Canadians' Safety (Victimization), 2014; General Social Survey on Social Identity, 2013; Programme for the International Assessment of Adult Competencies, 2012
Youth are less likely to vote but are still socially and civically engaged
Giving, volunteering and participating
- 69% of 15 to 24 years olds are members of a group, organization or association, compared with 65% for the overall Canadian population.
- 66% of youth aged 15 to 19 volunteer, as do 42% of youth aged 20 to 34.
- 81% of those aged 25 to 34 said they gave to a charitable or non-profit organization.
- Youth have confidence in public institutions – 50% of youth aged 15 to 24 have confidence in Canadian Parliament, compared with 37% for the general population.

Description for Chart 11
| 2011 | 2015 | |
|---|---|---|
| Sources: Statistics Canada, General Social Survey on Giving, Volunteering and Participating, 2013; General Social Survey on Social Engagement, 2003; General Social Survey on Social Identity, 2013; Elections Canada, Estimation of Voter Turnout by Age Group and Gender at the General Election, 2011 and 2015 | ||
| 18 to 24 | 38.8 | 57.1 |
| 25 to 34 | 45.1 | 57.4 |
| 35 to 44 | 54.5 | 61.9 |
| 45 to 54 | 64.5 | 66.6 |
| 55 to 64 | 71.5 | 73.7 |
| 65 to 74 | 75.1 | 78.8 |
| 75 and over | 60.3 | 67.4 |
Did you know?
The proportion of young people aged 15 to 34, who stated that they rarely or never followed news and current affairs, almost doubled, from 11% in 2003 to 21% in 2013.
Youth aged 15 to 34 contribute 29% of all volunteer hours in Canada.
Youth participate actively in sports, arts and cultural activities

Description for Chart 12
| Percent who actively participated in sports during past 12 months, by age | ||||
|---|---|---|---|---|
| 15-19 | 20-34 | 35-54 | 55 or older | |
| Low household income (<$60,000) | 55.1 | 23.4 | 17.1 | 10.0 |
| Moderate household income ($60,000-$139,999) | 60.2 | 34.4 | 27.3 | 20.4 |
| High household income ($140,000 or more) | 46.6 | 43.9 | 32.9 | 32.7 |
| Sources: Statistics Canada, General Social Survey on Canadians at Work and Home, 2016 | ||||

Description for Chart 13
| Percent who actively participated in arts/culture activity during past 12 months, by age | ||||
|---|---|---|---|---|
| 15-19 | 20-34 | 35-54 | 55 or older | |
| Low household income (<$60,000) | 67.7 | 53.5 | 48.6 | 45.7 |
| Moderate household income ($60,000-$139,999) | 65.5 | 55.5 | 44.3 | 48.6 |
| High household income ($140,000 or more) | 73.4 | 58.2 | 47.1 | 51.0 |
| Sources: Statistics Canada, General Social Survey on Canadians at Work and Home, 2016 | ||||
Youth are more educated than ever
- 97% of 15 year olds attend school
- 5% of 21 year olds enroll in apprenticeship programs
- 24% of 19 year olds in college
- 36% of 21 year olds at university
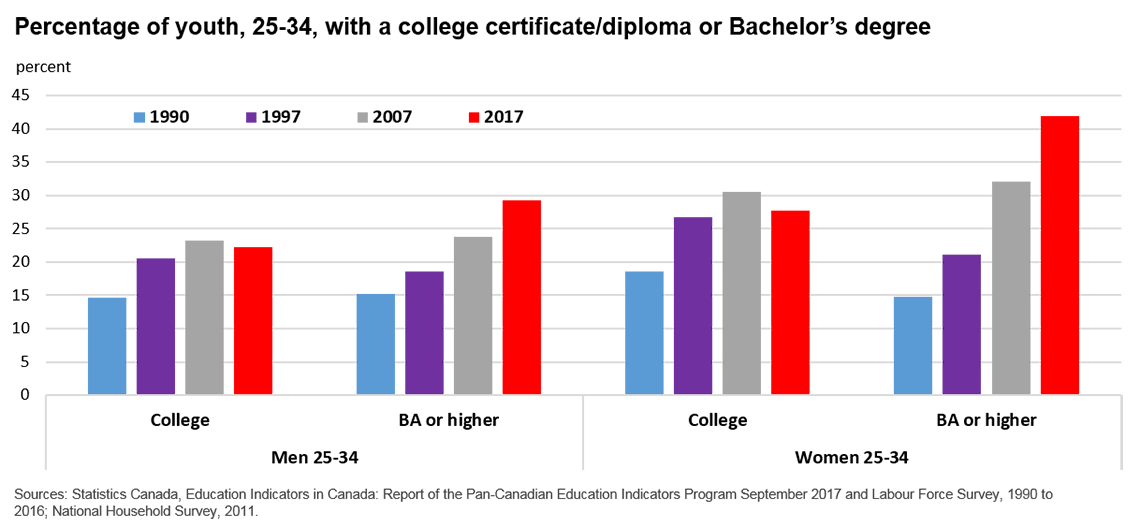
Description for Chart 14
| Men | Women | |||
|---|---|---|---|---|
| College | BA or higher | College | BA or higher | |
| 1990 | 14.6 | 15.2 | 18.6 | 14.7 |
| 1997 | 20.5 | 18.6 | 26.7 | 21.2 |
| 2007 | 23.2 | 23.8 | 30.5 | 32.1 |
| 2017 | 22.2 | 29.3 | 27.7 | 41.8 |
| Sources: Statistics Canada, Education Indicators in Canada: Report of the Pan-Canadian Education Indicators Program September 2017 and Labour Force Survey, 1990 to 2016; National Household Survey, 2011. | ||||
Did you know?
A large gap in postsecondary enrolment remains between youth from lower and higher income families. Non-financial factors, such as academic performance and parental education, play a significant role.
In 2016, 9% of men and 5% of women aged 25 to 34 had not completed high school, compared to 22% and 19%, respectively, in 1990. In 2011, 31% of Indigenous men and 25% of Indigenous women had not completed high school.
Young men and women continue to enter different types of programs and fields of study

Description for Chart 15
| Women | Men | |
|---|---|---|
| % | ||
| Sources: Statistics Canada, Postsecondary Student Information System, 2014-2015. Statistics Canada, Postsecondary Student Information System, 1992/93 and 2014/15; Programme for the International Assessment of Adult Competencies, 2012 | ||
| Mathematics & Computer Science | 1.7 | 5.8 |
| Engineering & Architecture | 3.9 | 17.3 |
| Education | 8.7 | 3.6 |
| Physical & Life Sciences | 9.2 | 10.0 |
| Humanities | 13.6 | 11.4 |
| Health | 15.0 | 8.4 |
| Business Mgmt & Public Admin. | 16.8 | 20.0 |
| Social Sciences | 20.0 | 13.6 |

Description for Chart 16
| Men | Women | |
|---|---|---|
| percentage points | ||
| Social sciences | -1.3 | 1.9 |
| Business Management and Public Administration | 3.6 | 2.1 |
| Health | 1.8 | 6.0 |
| Humanities | -3.2 | -4.9 |
| Physical and life sciences | 0.3 | 2.1 |
| Education | -2.2 | -4.4 |
| Engineering and Architecture | 4.0 | 1.5 |
| Mathematics and Computer Science | 0.2 | -0.3 |
| Sources: Statistics Canada, Postsecondary Student Information System, 2014-2015. Statistics Canada, Postsecondary Student Information System, 1992/93 and 2014/15; Programme for the International Assessment of Adult Competencies, 2012 | ||
Did you know?
Literacy and numeracy scores are higher among 25 to 34 year olds than any other age group.
Lifetime earnings vary considerably across educational attainment and fields of study
Among youth from the early 1990s, average cumulative earnings through their thirties and forties were over $700,000 higher among men with a bachelor's degree than among men with a high school diploma.
Among women, the difference was $442,000.
These results varied significantly by field of study:
- Men with an engineering degree made over 50% more than men with a degree in the humanities.
- Women in mathematics, physical sciences and business administration made 25% more than women in the social sciences.

Description for Chart 17
| Women | Men | |
|---|---|---|
| Sources: Statistics Canada, Longitudinal Worker File and 1991 Census. | ||
| Humanities | $808,200 | $1,144,600 |
| Education | $1,044,600 | $1,290,400 |
| Social Sciences | $824,300 | $1,358,900 |
| Mathematic & Physical Sciences | $1,148,700 | $1,607,500 |
| Business Administration | $1,169,100 | $1,619,400 |
| Health | $1,094,000 | $1,627,600 |
| Engineering | $972,600 | $1,845,000 |
Costs of education have increased and many graduates continue to be burdened with debt
- Tuition fees for full-time undergraduate students increased faster than the rate of inflation over the last decade.
- Average tuition fees for full-time Canadian undergraduate students are lowest in Quebec and Newfoundland and Labrador and highest in Prince Edward Island and Ontario.
- 50% of youth graduating with a bachelor's degree have student debts, similar to the early 2000s.
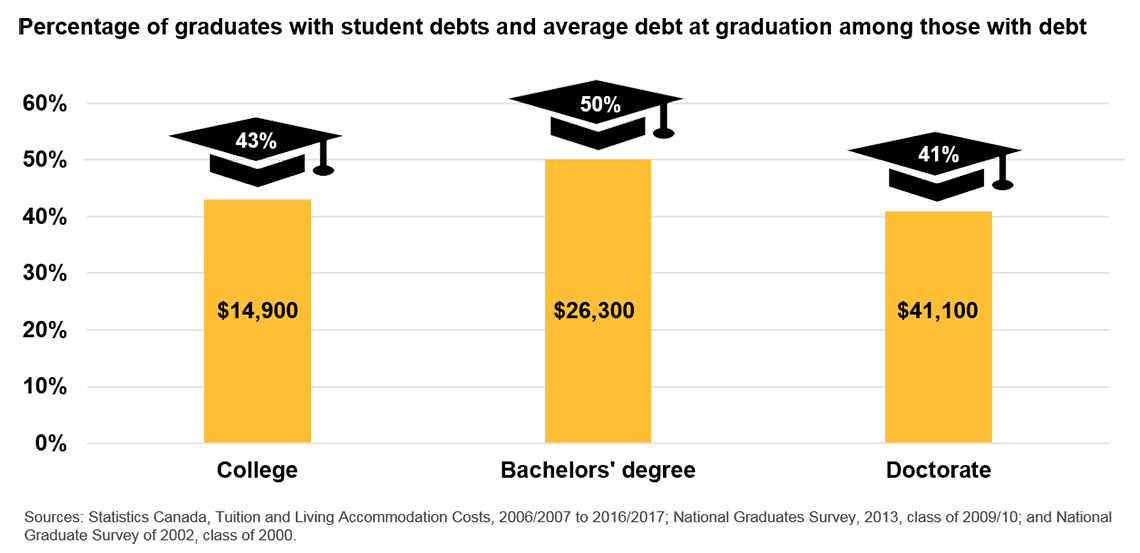
Description for Chart 18
| College | Bachelors' degree | Doctorate | |
|---|---|---|---|
| Sources: Statistics Canada, Tuition and Living Accommodation Costs, 2006/2007 to 2016/2017; National Graduates Survey, 2013, class of 2009/10; and National Graduate Survey of 2002, class of 2000. | |||
| Percentage of graduates with student debts | 43% | 50% | 41% |
| Average debt at graduation | $14,900 | $26,300 | $41,100 |
How are Canadian youth doing?
Fewer young men in full-time or permanent jobs...resulting in lower earnings at the middle and lower end of the earnings distribution
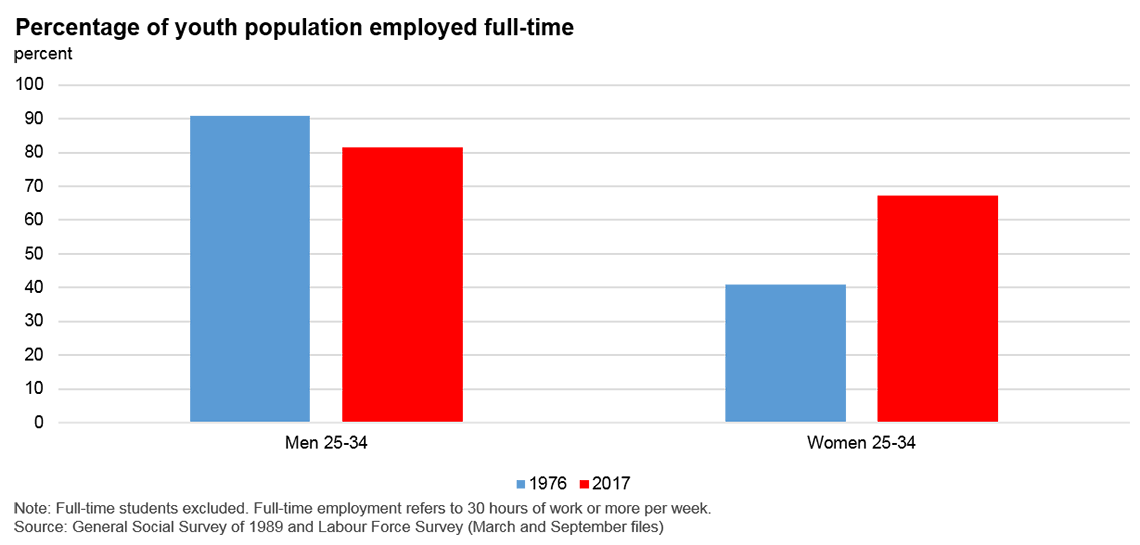
Description for Chart 19
| 1976 | 2017 | |
|---|---|---|
| Note: Full-time students excluded. Full-time employment refers to 30 hours of work or more per week. Source: General Social Survey of 1989 and Labour Force Survey (March and September files) |
||
| Men 25-34 | 90.7 | 81.6 |
| Women 25-34 | 40.9 | 67.2 |

Description for Chart 20
| 1989 | 2017 | |
|---|---|---|
| Note: Full-time students excluded. Full-time employment refers to 30 hours of work or more per week. Source: General Social Survey of 1989 and Labour Force Survey (March and September files) |
||
| Men 25-34 | 4.8 | 10.9 |
| Women 25-34 | 3.0 | 11.9 |
Did you know?
The percentage of young women employed full-time rose because of their growing labour force participation.
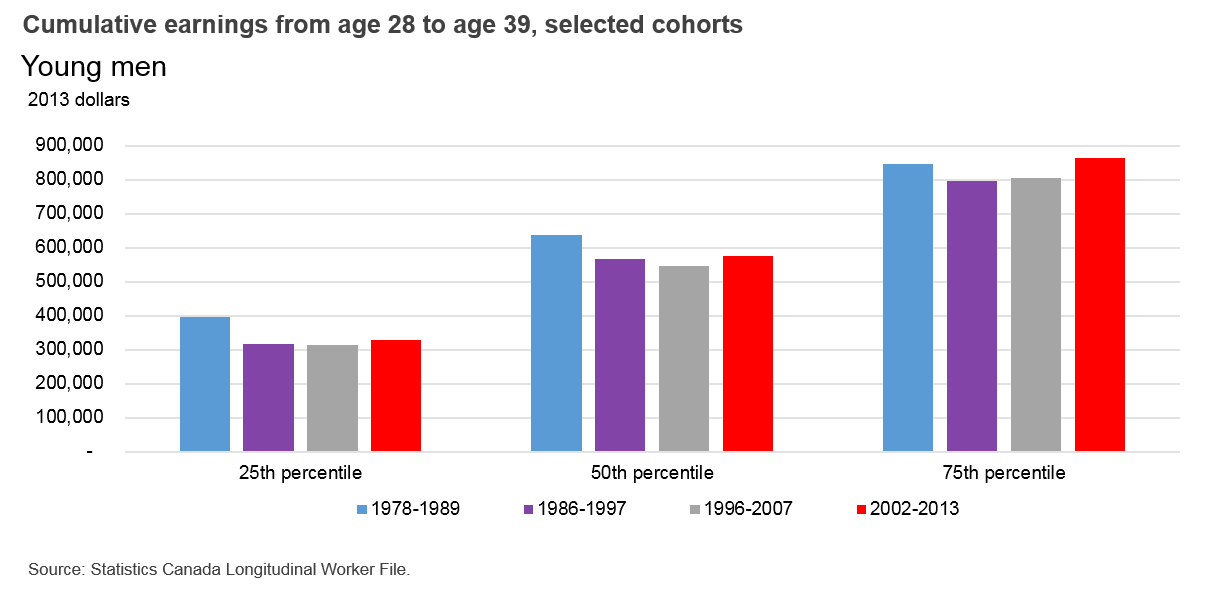
Description for Chart 21
| 25th percentile | 50th percentile | 75th percentile | |
|---|---|---|---|
| Source: Source: Statistics Canada Longitudinal Worker File. | |||
| 1978-1989 | 397,435 | 637,327 | 847,450 |
| 1986-1997 | 317,489 | 565,978 | 795,767 |
| 1996-2007 | 312,567 | 547,548 | 805,800 |
| 2002-2013 | 327,486 | 576,889 | 863,941 |
Did you know?
Young men and women at the top of the earnings distribution are faring better than ever.
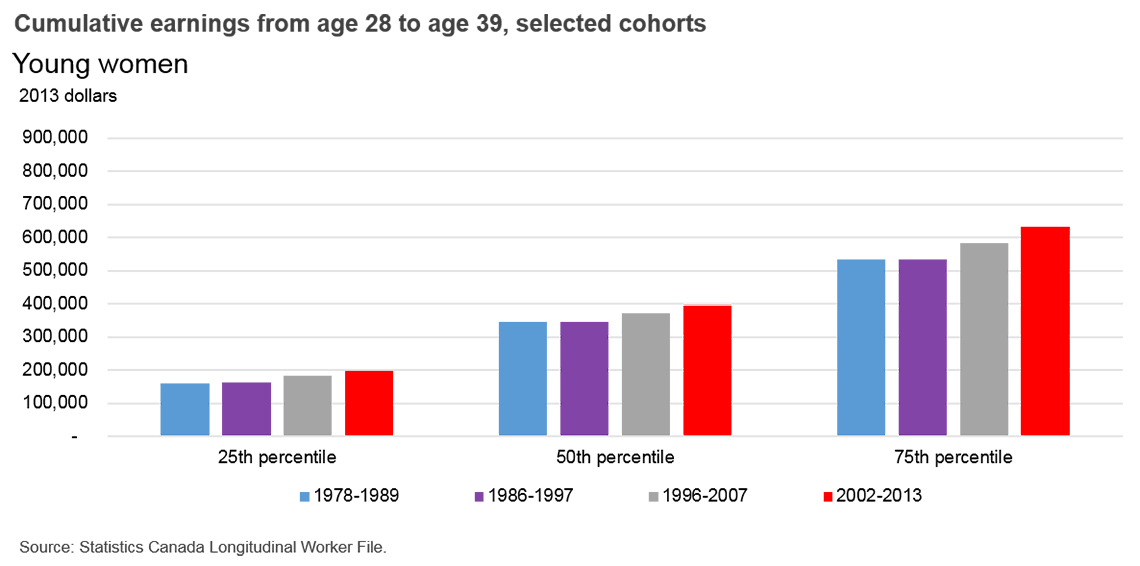
Description for Chart 22
| 25th percentile | 50th percentile | 75th percentile | |
|---|---|---|---|
| Source: Source: Statistics Canada Longitudinal Worker File. | |||
| 1978-1989 | 160,564 | 345,545 | 532,732 |
| 1986-1997 | 163,161 | 345,499 | 533,387 |
| 1996-2007 | 184,938 | 371,346 | 583,957 |
| 2002-2013 | 199,073 | 395,382 | 633,561 |
Did you know?
In contrast to young men, young women have significantly increased their annual hours of work and moved to better-paid occupations, resulting in higher cumulative earnings.
Some of the occupations in which youth are working
Among employed women aged 25 to 34...
- ...about 30% work in professional occupations, such as nurses, teachers and accountants
- ...about 15% work in technical and paraprofessional occupations, such as paralegals and health technicians
- ...about 17% work in administrative occupations, such as office administrators
- ...and about 19% work in personal and customer service occupations, such as food and beverage servers and information services representatives
Among employed men aged 25 to 34...
- ...about 20% work in professional occupations, such as computers and IT professionals, accountants and engineers
- ...about 10% work in technical and paraprofessional occupations, such as computer tech support, firefighters and police officers
- ...about 18% work in industrial and construction occupations, such as electricians, carpenters and mechanics
- ...and about 11% work in personal and customer service occupations, such as cooks and food and beverage servers
Source: Statistics Canada, Labour Force Survey, 2016
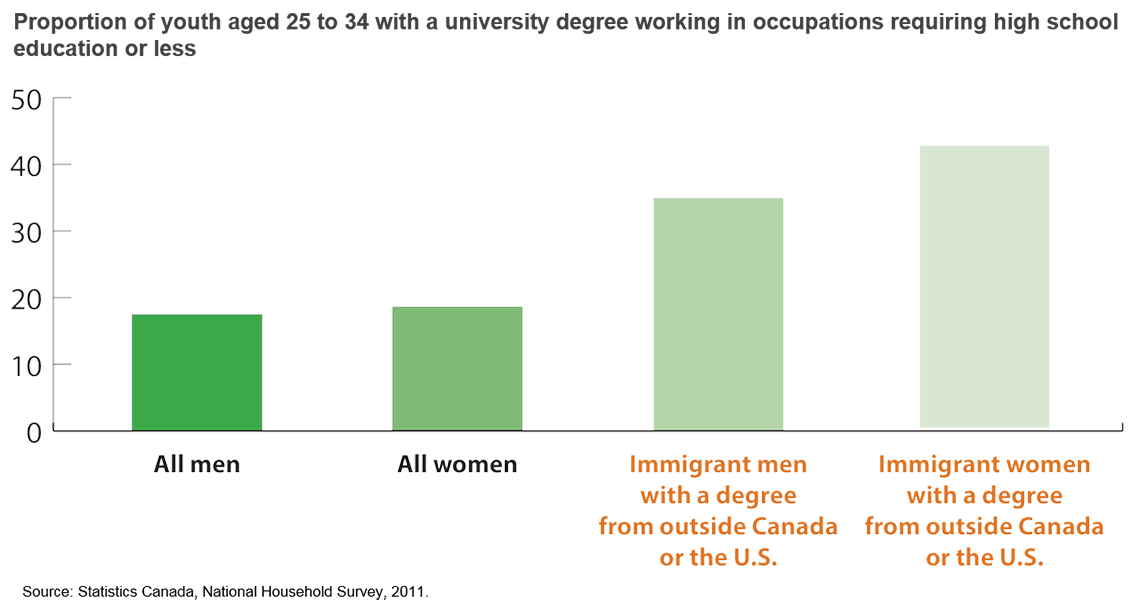
Some groups are more likely to be overqualified than others
Description for Chart 23
| Percentage | |
|---|---|
| All men | 17.7 |
| All women | 18.3 |
| Immigrant men with a degree from outside Canada or the U.S. | 34.8 |
| Immigrant women with a degree from outside Canada or the U.S. | 43.0 |
| Source: Source: Statistics Canada, National Household Survey, 2011. | |
Low-income rates among Canadians aged 25 to 34
| Percent (%) | |
|---|---|
| Total | 12.7 |
| Not residing with any family members | 20.4 |
| Aboriginal people off-reserve | 24.3 |
| With a disability | 29.4 |
Did you know?
In 2014, 10.5% of young Canadians aged 25 to 34 and 4.8% of Canadians aged 15 to 24 reported that they had ever temporarily lived with family, friends, in their car, or anywhere else because they had nowhere else to live–a situation referred to as ‘hidden' or ‘concealed' homelessness.
Note: Results are based on the low income measure after tax (LIM-AT)

Description for Chart 24
| 2000 | 2012 | |
|---|---|---|
| Note: results are based on the low income measure after tax (LIM-AT). Sources: Statistics Canada, Canadian Income Survey, 2015; General Social Survey on Canadians' Safety (Victimization), 2014; Longitudinal Immigration Database. |
||
| Immigrants in Canada 5 to 10 years | 14% | 9% |
| Canadian-born & Immigrants in Canada more than 20 years | 7% | 4% |
Homeownership among youth recently declined for the first time in 20 years
- Homeownership among younger adults aged 20 to 34 remained significantly lower than for older Canadians.
- Between 2006 and 2016, homeownership rates across all age groups, except for those aged 65 years old and over declined. This follows several decades of gradual increase. The decline was largest for younger adults, particularly over the past 5 years.
- Coincides with other broader trends such as the rising share of youth who are living with their parents, delays in starting a family, and the increase in housing costs.

Description for Chart 25
| 2006 | 2011 | 2016 | |
|---|---|---|---|
| Sources: Statistics Canada, National Household Survey, 2011; Census of Population, 2006 and 2016. | |||
| 20 to 34 years old | 45.7 | 47.3 | 43.6 |
| 35 to 54 years old | 72.5 | 72.3 | 70.1 |
| 55 to 64 years old | 77.7 | 77.1 | 76.3 |
| 65 years old and over | 72.2 | 73.6 | 74.6 |
One-third of youth with a severe disability say they have been refused a job because of their condition
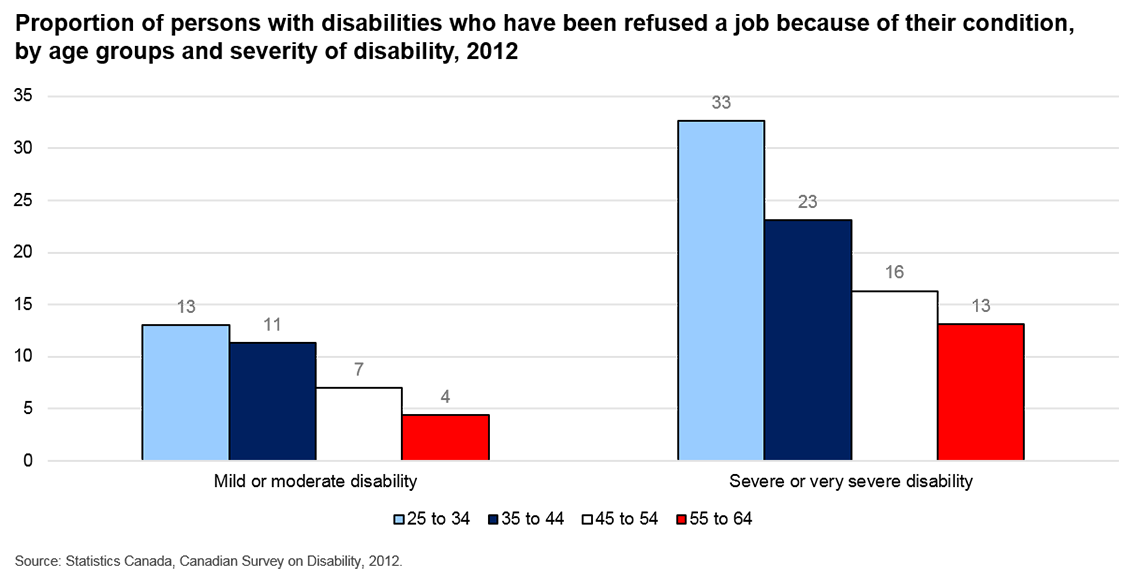
Description for Chart 26
| Mild or moderate disability | Severe or very severe disability | |
|---|---|---|
| 25 to 34 | 13 | 33 |
| 35 to 44 | 11 | 23 |
| 45 to 54 | 7 | 16 |
| 55 to 64 | 4 | 13 |
| Sources: Statistics Canada, Canadian Survey on Disability, 2012. | ||
Youth aged 15 to 24 are more likely to report that they experienced discrimination

Description for Chart 27
| 15 to 34 | 35+ | |
|---|---|---|
| All population | 17.5 | 11.5 |
| Women | 20.3 | 12.0 |
| Visible minorities | 22.5 | 18.2 |
| With a disability | 33.3 | 18.1 |
| LGB (18+ only) | 48.6 | 23.1 |
| Sources: Statistics Canada, General Social Survey on Canadians' Safety (Victimization), 2014; Canadian Community Health Survey, 2016. | ||
Did you know?
In 2016, 16% of young men and 12% of young women reported experiencing at least one aspect of social isolation. Results were broadly similar across all youth and compared with adults aged 35 to 55.
Some young men and women face serious mental health problems
- Rates of mood disorders are highest among youth aged 15 to 24 compared to other age groups; young women in particular have the highest rate (10%)
- Approximately 50% of youth who have experienced mood disorder have also had suicidal thoughts in their lifetime
- Suicide is the second leading cause of death among youth aged 15 to 24
- 14.7 deaths per 100,000 for young men
- 5.8 deaths per 100,000 for young women
- Less than half of youth with depression or suicidal thoughts have sought professional support
Sources: Statistics Canada, Canadian Community Health Survey Mental Health, 2012; Vital Statistics, 2014
Indigenous youth are particularly at risk for poor mental health
- 11.0% of off-reserve First Nations and 7.8% of Métis youth report having a mood disorder
- Rates of acute-care hospitalizations for intentional self-harm are high among indigenous youth aged 10 to 19
- 42 per 100,000 for First Nations youth living on reserve
- 26 per 100,000 for First Nations youth living off reserve
- 20 per 100,000 for Métis youth
- 101 per 100,000 for Inuit youth living in Inuit Nunangat
Sources: Statistics Canada, Canadian Community Health Survey, 2011-2014; Census of Population, 2006; CIHI Discharge Abstract Database, 2006-2009.
High rates of obesity and physical inactivity put youth at risk for heart disease later in life
The share of youth 18-34 who are overweight or obese increased significantly since the late 1970s—from 29% to about 45% in the early 2000s. The share has remained stable over the last decade.
Youth are also not meeting physical activity guidelines—only 1 in 6 are meeting the recommended 150 minutes of physical activity per week.
Only 25% of young men and 37% of young women (aged 18-34) consume the recommended 5 servings of fruits and vegetables per day.
These factors are potentially putting youth at risk of cardiovascular disease later in life.
Based on a new CanHeart Index which measures risk factors for heart disease including diet, weight and physical activity, approximately 1 in 4 youth aged 20-29 rank as having poor heart health.
Sources: Statistics Canada, Canadian Community Health Survey; Canadian Health Measures Survey
Drinking, smoking, and cannabis use by young people have generally declined...but new challenges are emerging
- Smoking rates for both young men and women have dropped significantly since the early 2000s.
- Heavy drinking by young men has also declined, but has increased for young women.
- While cannabis use is still generally higher among youth compared to older Canadians, it has generally decreased for youth.
Today's youth are dealing with the challenges of new drugs and addictions
- Opioid-related hospitalization rates rise fastest among youth.
- Rate of hospital based opioid events increased by 53% over the last decade – most of the increase in the last 3 years (CIHI, 2017).
- Rates of opioid related hospitalizations are up to 7 times higher among Indigenous youth and 5 times higher among lower income households.
Opioid hospitalizations by income

Description for Chart 28
| Household income | Rate of hospitalization |
|---|---|
| 1 (lowest) | 11.9 |
| 2 | 8.7 |
| 3 | 5.4 |
| 4 | 5.5 |
| 5 (highest) | 2.1 |
| Sources: Statistics Canada, Canadian Community Health Survey; Canadian Tobacco Use Monitoring Survey, 2004-2012; Canadian Tobacco, Alcohol and Drugs Survey, 2013-2015; Census of Population, CIHI Discharge Abstract Database. | |
Did you know?
Daily or occasional smoking dropped from over one third of young men aged 18 to 34 in 2003 to about one quarter in 2016. For young women, about 18% reported smoking in 2016 compared to 27% in 2003. Heavy drinking for males aged 20 to 34 was 35% in 2016, down from almost 40% in 2003. Heavy drinking for young women increased from 17% in 2003 to 23% in 2016.
Youth are more likely to commit crimes...but also more likely to be victims of violent crimes

Description for Chart 29
| Older adults aged 25 and older | Young adults aged 18 to 24 | Youth aged 12 to 17 | |
|---|---|---|---|
| Other federal statute violations | 25 | 71 | 221 |
| Drug offences | 215 | 1,108 | 657 |
| Criminal Code traffic violations | 252 | 506 | 53 |
| Other Criminal Code offences | 699 | 1,945 | 918 |
| Property crime | 701 | 1,959 | 2,124 |
| Violent crime | 649 | 1,524 | 1,281 |
| Sources: Statistics Canada, Canadian Centre for Justice Statistics, Incident-based Uniform Crime Reporting Survey, 2014. General Social Survey (Victimization), 2014. | |||

Description for Chart 30
| Age | Rate per 1,000 population |
|---|---|
| 15 to 19 | 155 |
| 20 to 24 | 170 |
| 25 to 29 | 150 |
| 30 to 34 | 86 |
| 35 to 39 | 80 |
| 40 to 44 | 56 |
| 45 to 49 | 82 |
| 50 to 54 | 57 |
| 55 to 59 | 49 |
| 60 to 64 | 24 |
| 65 to 69 | 17 |
| 70 or older | 10 |
| Note: Violent victimization includes sexual assault, robbery and physical assault. Sources: Statistics Canada, Canadian Centre for Justice Statistics, Incident-based Uniform Crime Reporting Survey, 2014. General Social Survey (Victimization), 2014. |
|
What's next?
Not the end of the story...let's talk
- Canada's youth continue to be a large and important group within the Canadian population.
- In many ways they are very different from younger generations before them...and from their parents and grandparents today.
- They are more diverse, educated, and connected and socially engaged than past youth, and in many ways are well positioned to succeed in today's complex global society.
- But not all young people are sharing these benefits. Some youth are unemployed or are in temporary jobs. Some are struggling with mental health challenges, addictions, and homelessness. And not everyone feels included.
- Statistics Canada wants to hear from you:
- Did we get this portrait of Canada's youth right? Are there parts of the story that are missing or more complicated?
- Contact us to share your thoughts and ideas to help us provide the information needed to make good decisions.
- Date modified: